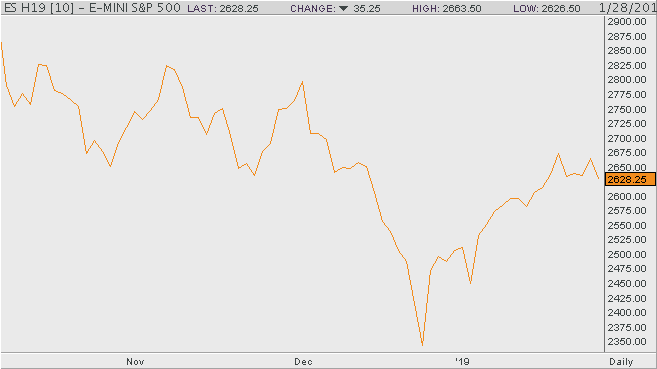
Good morning traders, it is officially Super Bowl week and everybody is gearing up for the big game, including the stock market. The S&P 500 started Monday down a full 1.2% due to lower than projected forecasts from Caterpillar and Nvidia Corp. These forecasts have helped exasperate worry of an economic slowdown due to China taking a bigger portion of corporate profits.
With this in mind, it’s time we think about the Super Bowl Indicator. The Super Bowl Indicator is a term that was first introduced in 1978 by Leonard Koppett, a sportswriter for the New York Times. The Super Bowl Indicator posits that when a team from the American Football Conference (AFC) wins the Super Bowl, the U.S. stock market will decline in the coming year, and when a team from the National Football Conference (NFC) wins, the U.S. stock market will rise. At one point in time, the Super Bowl Indicator had an over 90% success rate but has had a bad run as of late with only a 50% success rate from 2007-2017 including a winless record the last 3 years.
In all seriousness, when it comes to predicting the stock market’s performance for the year, the outcome of the Super Bowl is completely unrelated. Regardless, it is something fun to think about and adds another level of interest to the outcome of the game, plus, if the Patriots win and the stock market performs poorly we can all blame Tom Brady.
e-Mini S&P 500 Mar ’19 Daily Chart

If you would like to learn more about S&P 500 futures, please check out our free Trading E-Mini S&P 500 Futures Guide.

