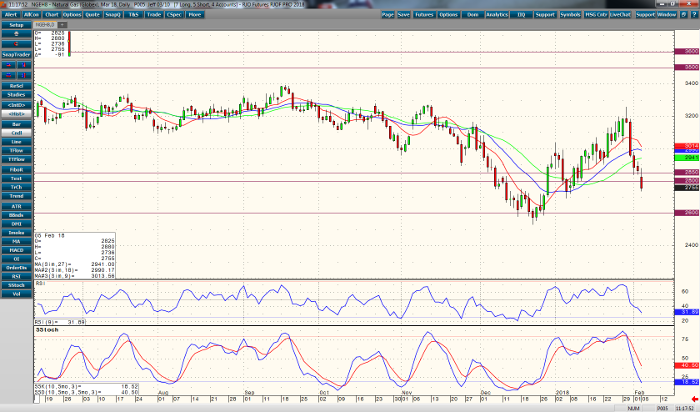
The January 30 topping and reversal action has signaled quite a downward slide. Last week’s forty plus cent slide from Wednesday’s 3.259 high to lows near 2.840 have done some serious technical damage on the charts. A nearby target at 2.693 I believe is well within reach. A close beneath this may signal a selloff to sub 2.600 levels, and challenge previous lows. Momentum studies and short-term moving averages are all down or rolling over in today’s action. A close above 2.980 might be necessary to reverse the trend.
The weather outlook calls for temperatures below freezing until February 14 or so. This may support gas prices, but increased production could keep the downward pressure on prices in the March contract. According to the EIA:
“To accommodate rising natural gas production over the past decade and to remain compliant with North Dakota’s increasingly stringent restrictions on natural gas flaring, the industry significantly expanded natural gas processing capacity across the state. Gas processing capacity in the state has expanded from slightly less than 500 million cubic feet per day (MMcf/d) at the end of 2010 to more than 2 billion cubic feet per day (Bcf/d) at the end of 2016, according to the North Dakota Pipeline Authority. By 2019, capacity is expected to grow an additional 700 MMcf/d above the 2016 total.”
This significant increase may keep prices low in the near-term. As always, I’m biased to the short side until the technicals make it obvious to move to a bullish stance.
Natural Gas Mar ’18 Daily Chart


