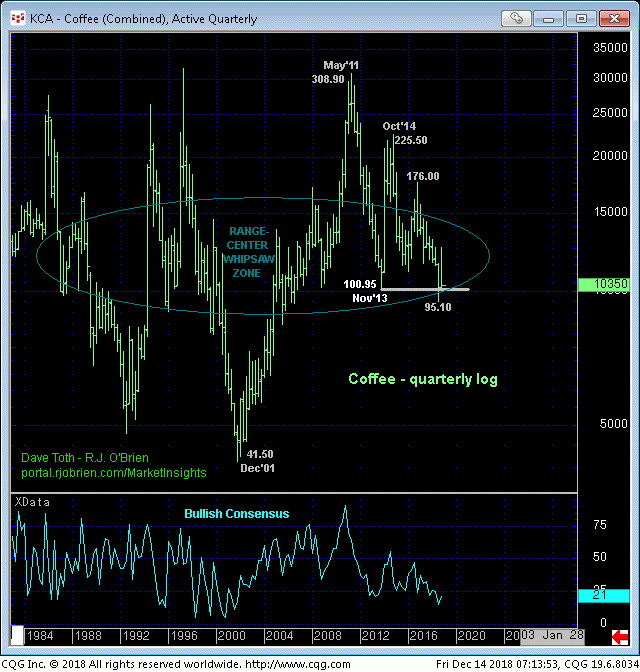
The past few days’ continued losses reaffirm the broader relapse from 19-Oct’s high. This slide leaves a litany of corrective highs in its wake, the latest smaller-degree one of which is 07-Dec’s 107.00 high. The market’s failure to sustain losses below this level will confirm a bullish divergence in momentum. But while such a minor mo failure will be of an insufficient scale to conclude anything more than an equally minor corrective bounce, traders are advised to err on the side of a more significant base/reversal process given the more extensive size of Oct-Dec’s prospective correction of Sep-Oct’s sharp and major rebound. In this regard we’re identifying this 107.00 level as our new short-term but potentially pivotal short-term risk parameter from which a still-advised bearish policy can be objectively rebased and managed.
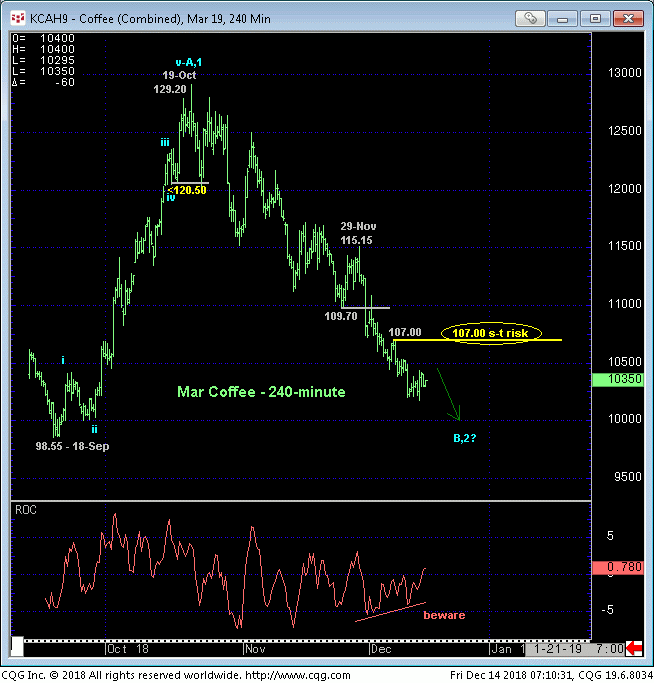
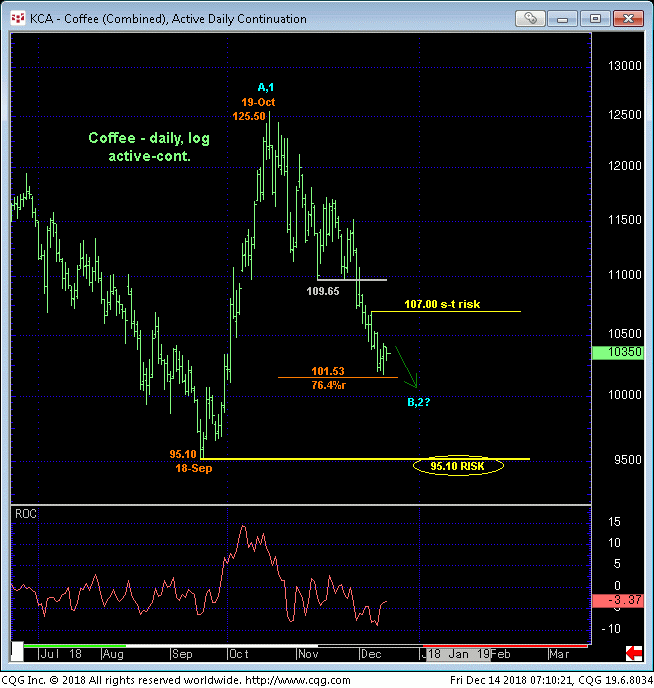
In 23-Oct’s Technical Blog following that day’s bearish divergence in momentum, we introduced a bearish count calling for a corrective rebuttal of Sep-Oct’s impressive, impulsive rally that was expected to be extensive in terms of both price and time, correcting 50%-to-61.8% OR MORE of Sep-Oct’s 95.10 – 125.50 rally. Yesterday’s 101.75 low was just 22 ticks away from the 76.4% retracement.
This relapse is either a (B- or 2nd-Wave) correction of Sep-Oct’s rally or it ain’t. And if it is, we’d expect this correction to end “somewhere down here”. We won’t be able to CONCLUDE a resumption of a multi-month base/reversal process following admittedly minor strength above 107.00. But at least such a rebound would reject/define a more reliable low and support from which any non-bearish decisions like short-covers and cautious bullish punts could be objectively based and managed. Until and unless this market proves even minor strength above a level like 107.00, the downtrend’s continuance should not come as a surprise, including a run to new lows below 95.10. This said, that 18-Sep 95.10 low remains intact as our key long-term risk parameter this market needs to break to negate a major base/reversal-threat count.
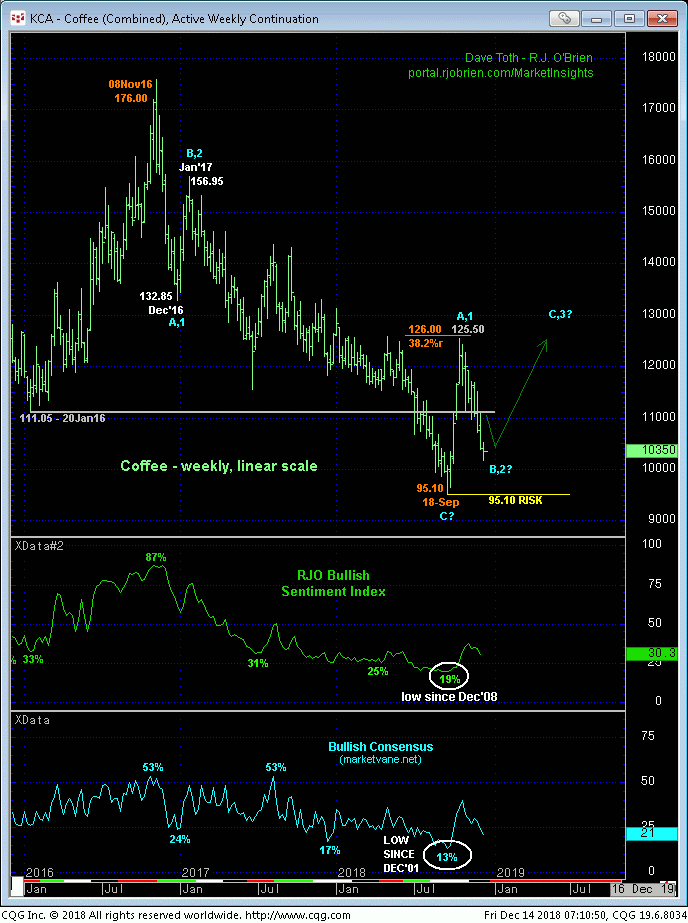
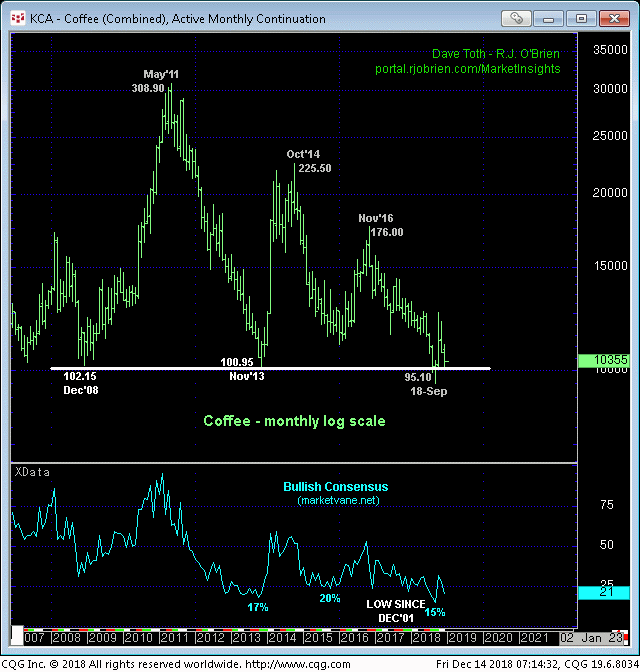
Finally and from a very long-term perspective, the monthly log chart above shows the obvious importance of the general $1.00/lb as a huge support area over the past 10 YEARS. A break below this area in general and below 95.10 specifically would expose a chasm totally devoid of any technical levels of merit shy of 2001’s 41.50 low. Indeed, the quarterly log chart below shows NOTHING below 95.10. This doesn’t mean we’re forecasting a move to 41-cents, but it certainly does mean that the market’s downside potential below 95.10 is indeterminable and potentially severe.
Could the market break 95.10 and fail miserably to sustain new lows just like it did in Sep when it broke Nov’13’s 100.95 key low? Sure. Absolutely. But we’d need PROOF of such “non-weakness” via a confirmed bullish divergence in momentum above a prior corrective high to reject/define another such low from which any non-bearish decisions could only then be objectively based and managed.
We’ve also circled the approximate 90-to-165-range that marks the middle-half bowels of this market’s 35-year range where aimless whipsaw behavior should be approached as the rule rather than the exception. This creates a very challenging environment where the odds of successful longer-term directional bets are lower, warranting a more conservative approach to risk assumption. Herein lies the importance of identifying flexion points and risk parameters like 107.00 and 95.10.
These issues considered, a bearish policy and exposure from 122.00 OB recommended in 23-Oct’s technical Blog remain advised with a recovery above 107.00 required to threaten this call enough to warrant its cover. In lieu of such 107.00+ strength further and possibly accelerated losses should not surprise.
