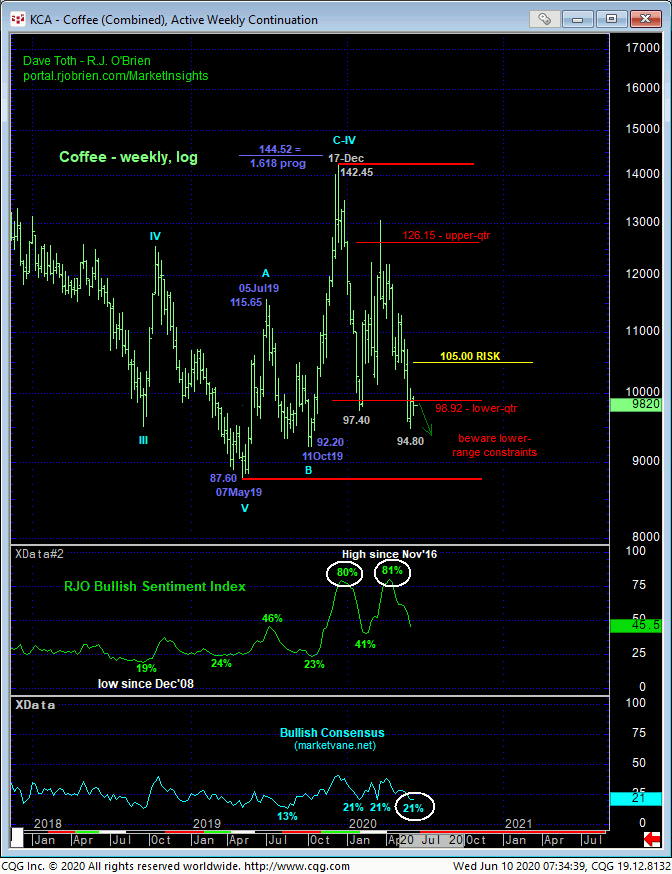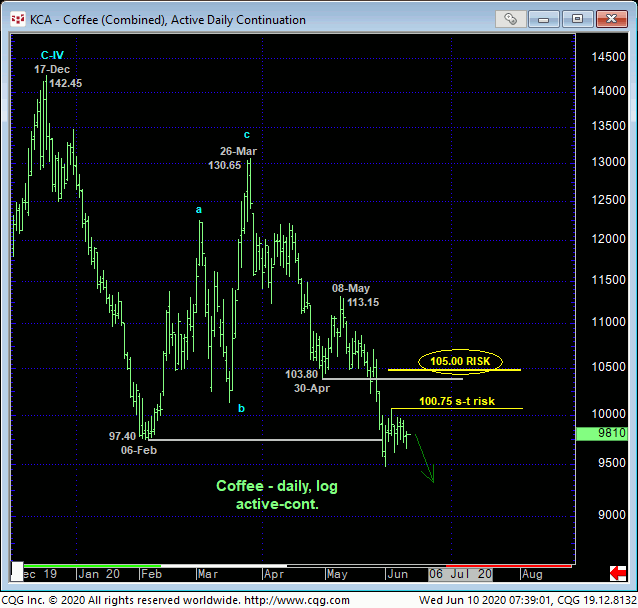

In 27-Mar’s Technical Blog following that day’s bearish divergence in admittedly short-term momentum but from the upper-quarter of the past year’s range, we discussed the 3-wave and thus corrective nature of Feb-Mar’s recovery that warned of a major peak/reversal environment and resumption of Dec-Feb’s downtrend that preceded the correction. As recently discussed, 29-May’s break below 06-Feb’s 97.40 confirms this call. But now that the market’s “down here”, we might have a technical environment that’s the inverse of late-Mar as the weekly log chart above shows the market’s proximity to the LOWER-quarter of the past year’s range amidst historically bearish levels in the Bullish Consensus (marketvane.net) measure of market sentiment that have warned of and accompanied all three of the past year’s major, if intra-range recoveries.
Under these circumstances and while continuing to respect the clear and present downtrend, our attention turns to MOMENTUM as the market needs to sustain trendy, impulsive price action lower to maintain a more immediate bearish count that continues to warrant a bearish policy. Any bullish divergence in momentum, even a smaller scale one, would not be able to be ignored as the start of another intra-range recovery that could be extensive.
This said, on a major scale below, May-Dec’19’s entire 87.60 – 142.45 recovery is only a 3-wave event as labeled. And just like Feb-Mar’s 3-wave and thus corrective recovery warned of a resumption of Dec-Feb’s downtrend that preceded it, 2019’s 3-wave recovery from 87.60 to 142.45 cannot be ignored as a correction that warns of an eventual resumption of secular bear market in coffee to levels below 87.60. But if the current down is THE 5th-Wave down to sub-87.60 levels, then it’s imperative that the bear BEHAVE LIKE ONE “down here” and continue to PERFORM.

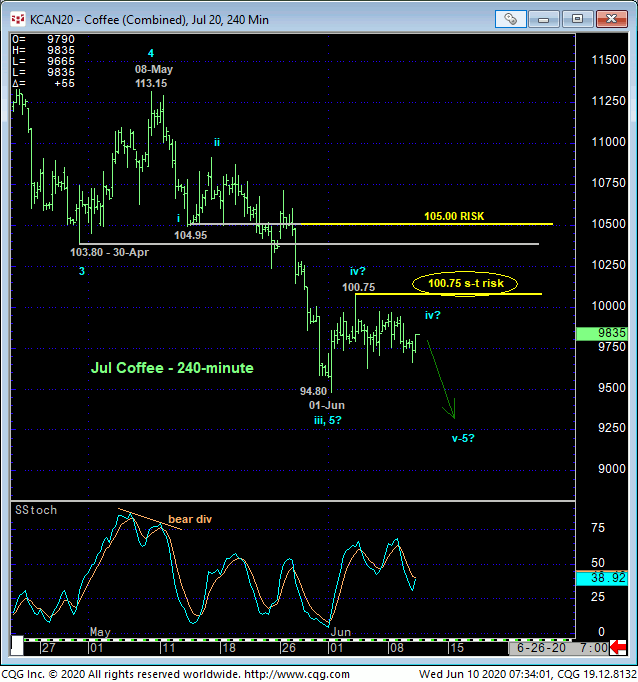
This required bear market performance will be gauged by how well the market sustains trendy, impulsive behavior lower. The daily (above) and 240-min (below) charts show a recent resistant high at 100.75 that we believe serves as the end or upper boundary of a suspected minor correction. A recovery above this level won’t necessarily negate the longer-term downtrend, but it confirm a bullish divergence in short-term mo that, given the market’s current position in the lower-quarter of the past year’s range amidst historically bearish sentiment should not be ignored as an early sign of an intra-range recovery that could be extensive. Per such, we’re identifying 100.75 as our new short-term risk parameter from which a bearish policy and exposure can be objective rebased and managed by shorter-term traders with tighter risk profiles.
Both the daily log scale chart above and 240-min chart below show key former support from the 103.80-to-104.94-area that, sine broken, we’d expect to hold as new resistance per any broader and more immediate bearish count. A recovery above 105.00 will threaten a broader bearish count enough to warrant a move to the sidelines by even long-term players to circumvent the heights unknown of a larger-degree correction or reversal higher. In this regard, we’re defining 105.00 as our new long-term risk parameter from which longer-term players can objectively rebase and manage the risk of a still-advised bearish policy and exposure.
In sum, a bearish policy and exposure remain advised with a recovery above 100.75 required for shorter-term traders to neutralize exposure and commensurately larger-degree strength above 105.00 for longer-term players to follow suit. In lieu of such strength, further and possibly accelerated losses should not surprise.


