Posted on Aug 22, 2023, 11:38 by Dave Toth
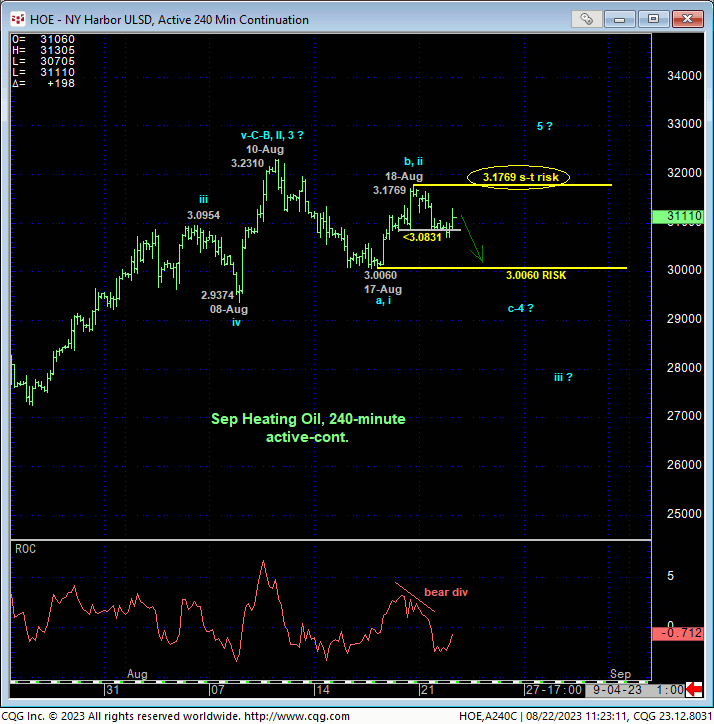
Today’s nondescript slip below Fri’s 3.0831 low confirms a bearish divergence in very short-term momentum and defines Fri’s 3.1769 high as one of developing importance and possibly the end of a (b- or 2nd-Wave) corrective rebuttal to 10-17-Aug’s 3.2310 – 3.0060 decline. The fact that this admittedly very minor mo failure stems from an attempt late last week to take out 10-Aug’s 3.2310 high reinforces this count calling for at least further (possible 4th-Wave) correction down from 3.2310 and possibly a more protracted correction or reversal lower given similar weakness in crude oil and RBOB. Per such, we’re identifying Fri’s 3.1769 high as our new short-term parameter from which shorter-term traders can objectively base non-bullish decisions like long-covers and cautious bearish punts.

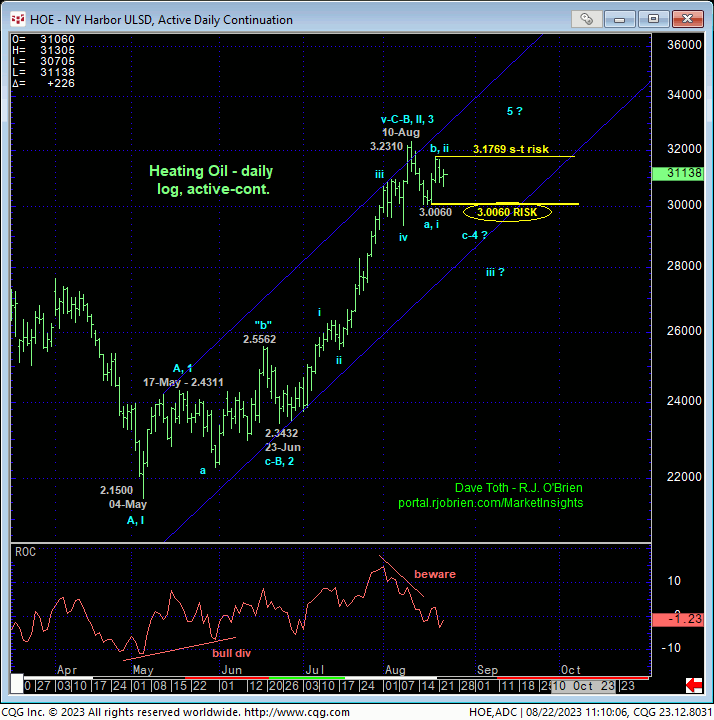
What’s interesting about this short-term count calling for at least further lateral-to-lower correction is that it sights a break of Fri’s 3.0060 low, the break of which will render that low an initial counter-trend low and confirm a bearish divergence in DAILY momentum. And while such a sub-3.0060 break would still fall well within the bounds of a prospective (4th-Wave) correction within the broader uptrend from 23-Jun’s 2.342 low, it is easy to see in the daily log chart below that there is little in the way of any technical levels of merit below 3.0o60 to look to as support. If/when the market breaks 3.0060, the ONLY way we’d be able to identify a more reliable low and support from which to rebase bull risk is AFTER a sell-off-stemming bullish divergence in momentum. “Hoping” for such a divergence to maintain a bullish policy exposes potentially steep risk and cost to bulls opting to stay the course. Per such, we’re also defining 3.0060 as our new key bull risk parameter pertinent to longer-term commercial players.

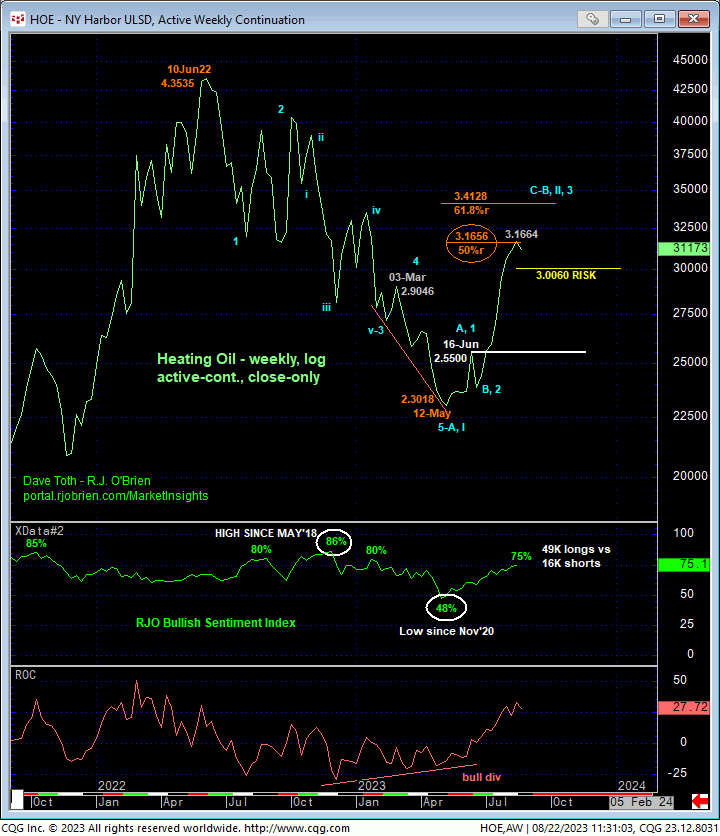
Contributing to the prospect of a larger-degree correction or reversal lower IF the market breaks 3.0060 is the combination of this market’s return to relatively frothy levels (75%) in our RJO Bullish Sentiment Index and the market’s exact 50% retrace of Jun’22 – May’23’s entire bear trend from 4.3535 to 2.3018 on a weekly log close-only basis shown below. Because of the extent and uninterrupted nature of Jul-Aug’s portion of the recent rally, this perspective shows NO levels of any technical merit below 3.0060 shy of former 2.55-area resistance-turned-support from mid-Jun. Now this doesn’t mean we’re forecasting a move to 2.55 of the 3.00-aera breaks, but it certainly does mean that the market’s downside potential below 3.0060 is indeterminable and potentially severe, questioning the risk/reward metrics of a continued bullish policy.
These issues considered, shorter-term traders are advised to move to a neutral-to-cautiously-bearish stance with a recovery above 3.1769 required to negate this call and re-expose the past quarter’s impressive recovery. Longer-term commercial players remain OK to maintain a bullish policy with a failure below 3.0060 required to defer or threaten this call enough to warrant its immediate cover ahead of potentially steep losses thereafter.


