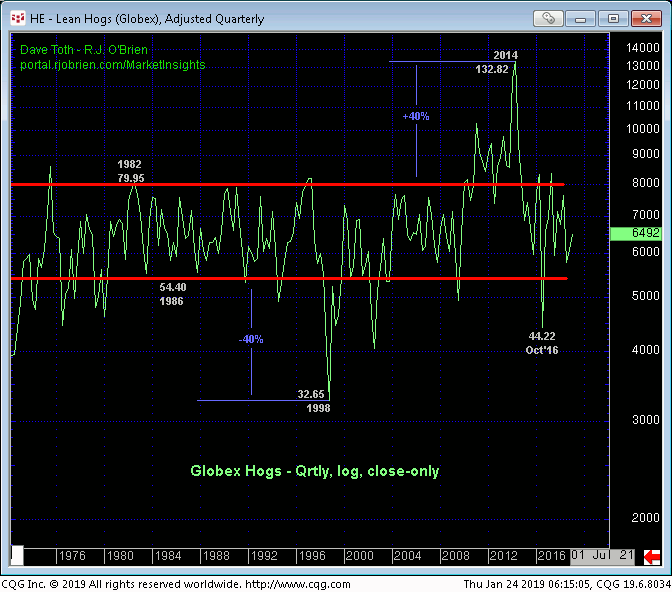
Yesterday’s continued slide, this time below 16-Jan’s 64.02 low in the now-prompt Apr contract detailed in the hourly chart below, reinforces our bearish count introduced in 17-Dec’s Technical Blog and leaves 18-Jan’s 67.40 high in its wake as the latest key corrective high this market now is minimally required to recover above to arrest a 2-month, 13% decline. Per such this 67.40 high is considered our new key risk parameter to which traders can objectively rebase and manage the risk of a bearish policy and exposure.
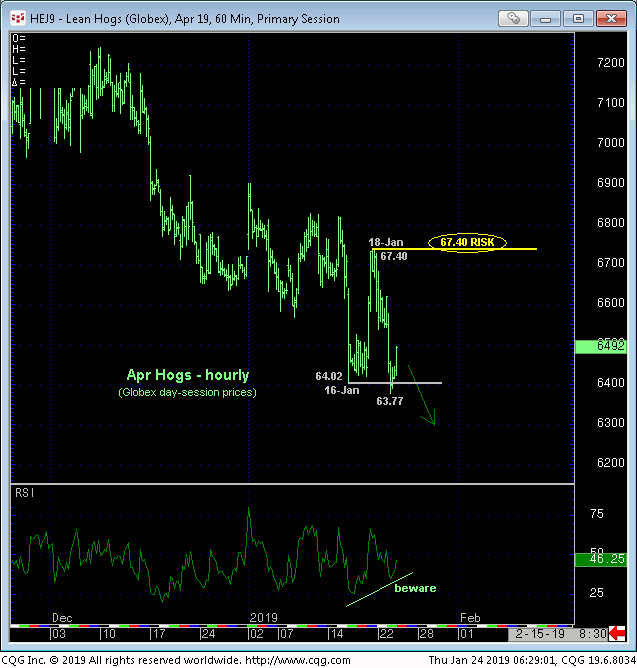
This 67.40 bear risk parameter may come in handy given a number of factors lining up that may be warning this decline may be near its end:
- the nicely developing POTENTIAL for a bullish divergence in daily momentum (above)
-
- (this divergence will be considered CONFIRMED to the point of non-bearish action after PROOF of strength above 67.40)
- the prospect that this week’s resumed slide from 67.40 is the completing 5th-Wave of a 5-wave Elliott sequence down from 20-Nov’s 73.42 high as labeled above
- the Fibonacci fact that yesterday’s 63.77 low is the exact 61.8% retrace of Jul-Nov’s 57.80 – 73.42 rally amidst
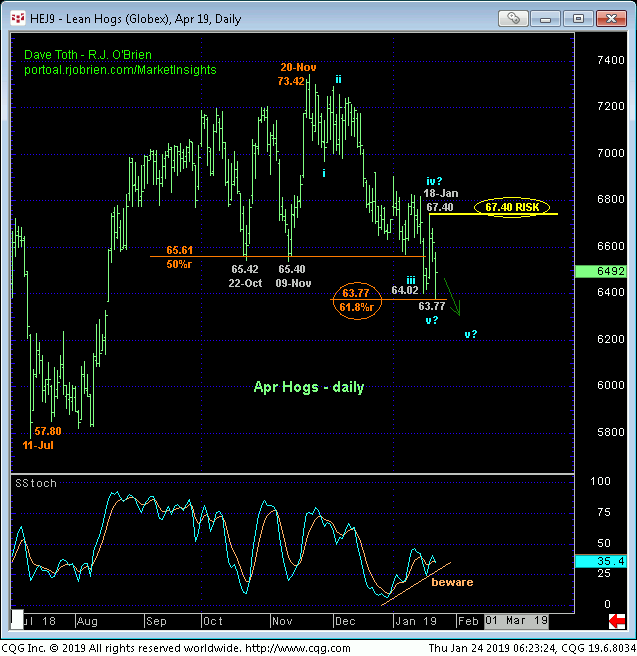
- historically bearish levels in the Bullish Consensus (marketvane.net) measure of market sentiment not seen since those that warned of and accompanied the major base and reversal from Jul’s low.
This is a compelling list of facts and factors that warn of a bottom. Until and unless the market recoups 18-Jan’s 67.40 high however, the simple downtrend pattern of lower lows and lower highs remain intact and should not surprise by its continuance or acceleration.
At a historically high 76% in early-Dec, our proprietary RJO Bullish Sentiment Index of the hot Managed Money positions reportable to the CFTC warned of a peak/reversal threat that resulted in a 13% decline thus far. This sentiment measure hasn’t been updated in a month because of the government showdown, but we’ll surmise that the accelerated decline from mid-Dec on was at least in part attributable to the market forcing some capitulation of this long-&-wrong exposure. Now, with the Bullish Consensus flirting with historical lows, the shoe might be on the other foot. Whether it is or isn’t however will depend, we believe, on how the market performs “down here” in general and below 67.40 specifically.
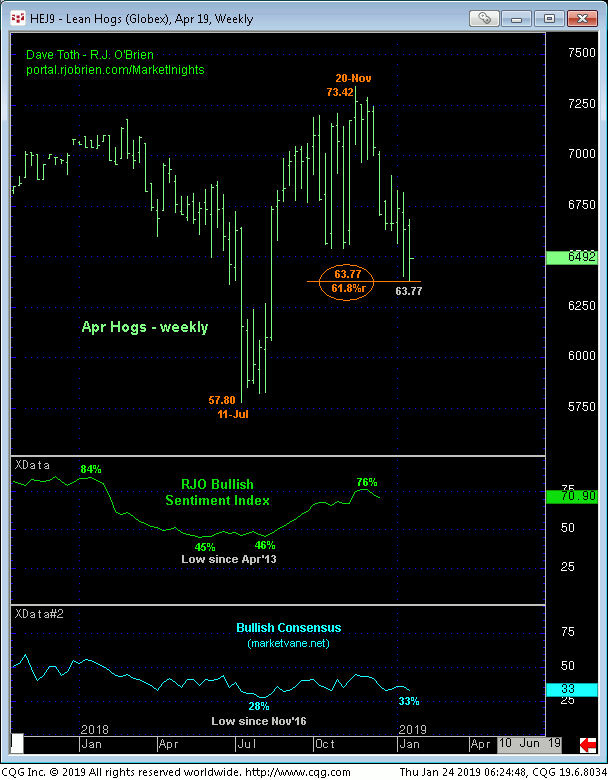
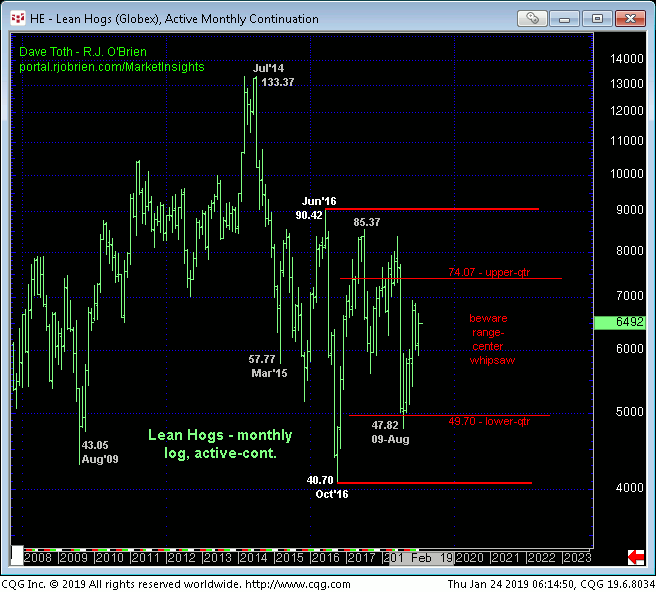
From an much longer-term, historical perspective, the monthly log active-continuation chart above and quarterly log close-only chart below show that the Apr contract is trading smack in the middle of its historical mean. While this range-center position does not mean this market can’t take off on a bigger, trendier tangent either way, it does warn us to beware of aimless whipsaw risk that makes for a challenging trading environment that warrants a more conservative approach to risk assumption. This approach emphasizes identifying tighter but objective risk parameters around which to base directional biases and exposure. 18-Jan’s 67.40 is precisely one of these.
In sum, a bearish policy remains advised with a recovery above 67.40 required to negate this specific call and warrant a move to a neutral/sideline position ahead of at least a more significant correction of Nov-Jan’s decline. In lieu of such 67.40+ strength further and possibly accelerated losses should not surprise. In the days/week ahead we will see if price action provides an even tighter, short-term risk parameter around which non-bearish decisions like short-covers can be objectively based.
