Posted on Feb 06, 2024, 06:56 by Dave Toth
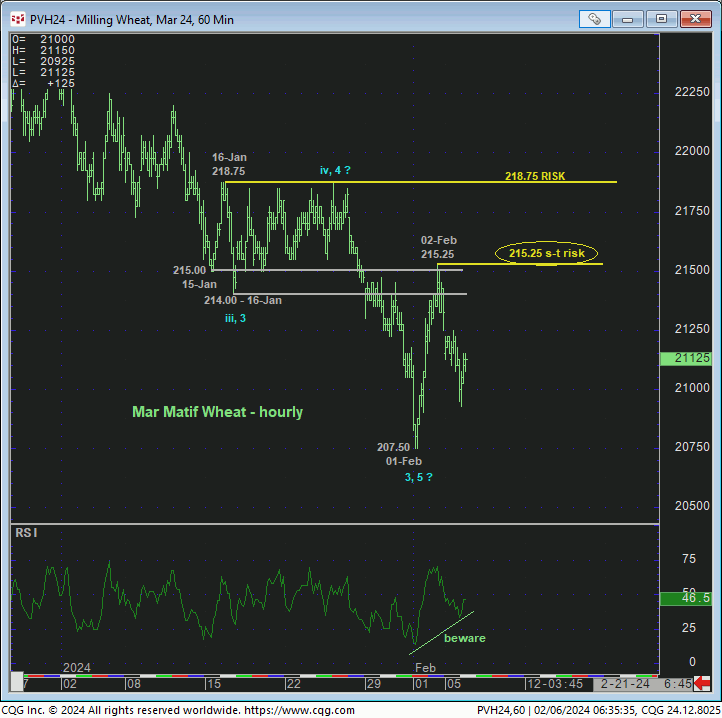
After plunging to yet another new low for the 21-month secular bear market last week, the hourly chart below shows last Thur/Fri’s spike recovery attempt that was stemmed by former support-turned-resistance from the 214-handle-area from mid-Jan. This week’s relapse leaves Fri’s 215.25 high in its wake as one of developing importance and one we would expect the market to now sustain losses below if the secular bear market is continuing. A recovery above 215.25 would be of too small a scale to conclude a larger-degree base/correction/reversal count. But by recouping what then would be an initial counter-trend high, the market would confirm a bullish divergence in short-term momentum that would at least reject/define a more reliable low and support from which non-bearish decisions like short-covers could then be objectively based and managed by shorter-term traders. Per such, we’re defining 215.25 as our new short-term parameter from which shorter-term traders can objectively rebase and manage the risk of a still-advised bearish policy and exposure.

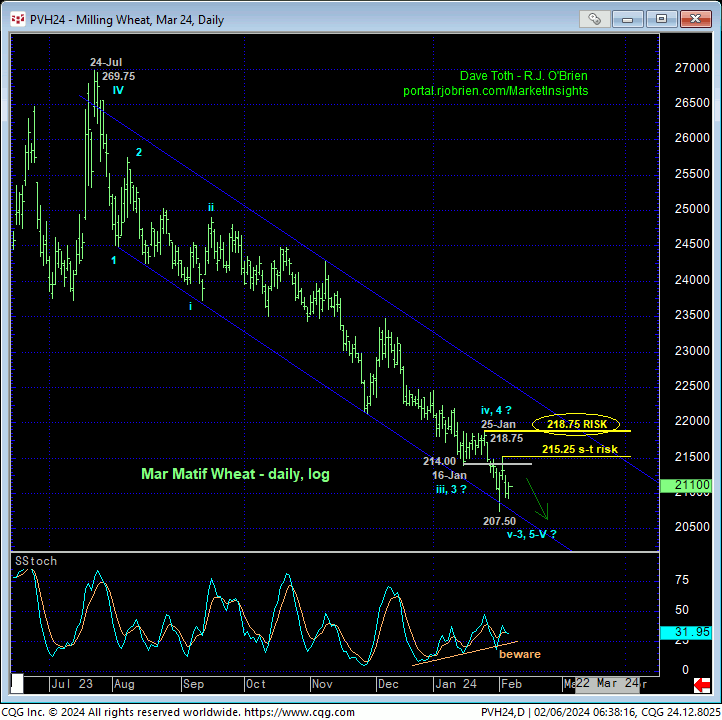
Stepping out to a daily perspective, the log scale chart of the Mar contract below shows the sheer magnitude of even the past six months’ portion of the secular bear market that should hardly surprise by its continuance or acceleration straight away. What’s also apparent is the developing POTENTIAL for a bullish divergence in momentum that will be considered CONFIRMED to the point of non-bearish action by longer-term commercial players on proof of strength above 25-Jan’s 218.75 larger-degree corrective high.
From an Elliott Wave perspective, there are too many iterative stair-steps or “waves” down within the decline from last Jul’s 269.75 high to have any confidence in counting 3- or 5-waves down from that 269.75 high. A recovery above 218.75 however would confirm at least some semblance of a more reliable low and support and expose at least a (4th-Wave) correction higher and possibly a more protracted reversal. As we don’t want to underestimate the “unknown” of what the market might have in store if/when it recoups 218.75, we are defining that level ads our new key longer-term bear risk parameter pertinent to longer-term commercial players.


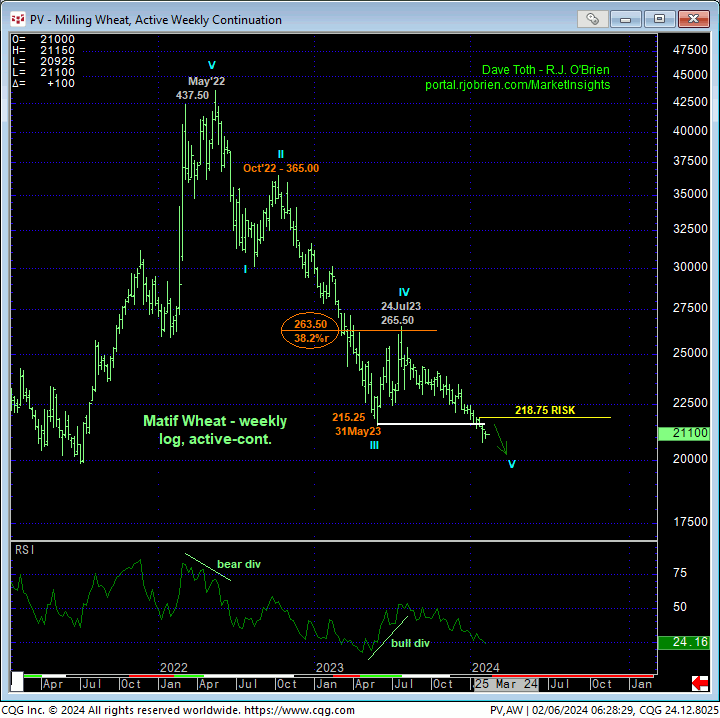
On an even broader scale, the weekly log active-continuation chart above shows the past 6-month resumption of the secular bear market that dates from May’22’s 437.50 all-time high. This is a massive bear market that could easily accelerate lower following last week’s break below last May’s 215.25 low.
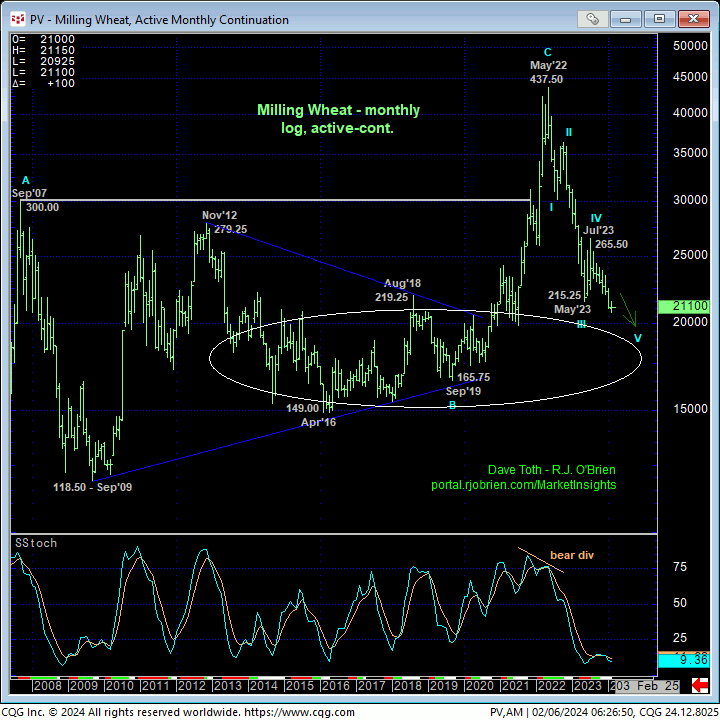
However, the monthly log chart below shows the market’s encroachment on a vast area between roughly 200 and 150 that housed SIX YEARS of lateral price action from 2014 to 2020 before the 2020 – 2022 secular bull trend exploded on the scene. If there’s an area that should be considered a major support “candidate”, we believe it is this 200-to-150-range.
There’s a lotta green between 200 and 150 to be sure. We are NOT saying that the 200.00 level is going to support/end the clear and present 21-month secular bear market. What we are saying however is that the “easy” bear trending money (if there is such a thing in trading) may be behind us. Whatever level or area is ultimately going to arrest this major bear, we believe it is highly likely that this major bear will enter a “slowdown” process prior to the eventual bottom, replete with increasingly volatile 2-steps-down-1-step-up price action. Herein lies the importance of tightening bear risk parameters to more recent corrective highs like 218.75 and even 215.25. Until/unless AT LEAST such strength is shown however, the trend remains down and should not surprise by its continuance or acceleration straight away.
These issues considered, a bearish policy and exposure remain advised with a recovery above 215.25 now required for shorter-term traders to take profits and move to the sidelines and commensurately larger-degree strength above 218.75 for longer-term commercial players to follow suit. In lieu of such strength, further losses remain expected.


