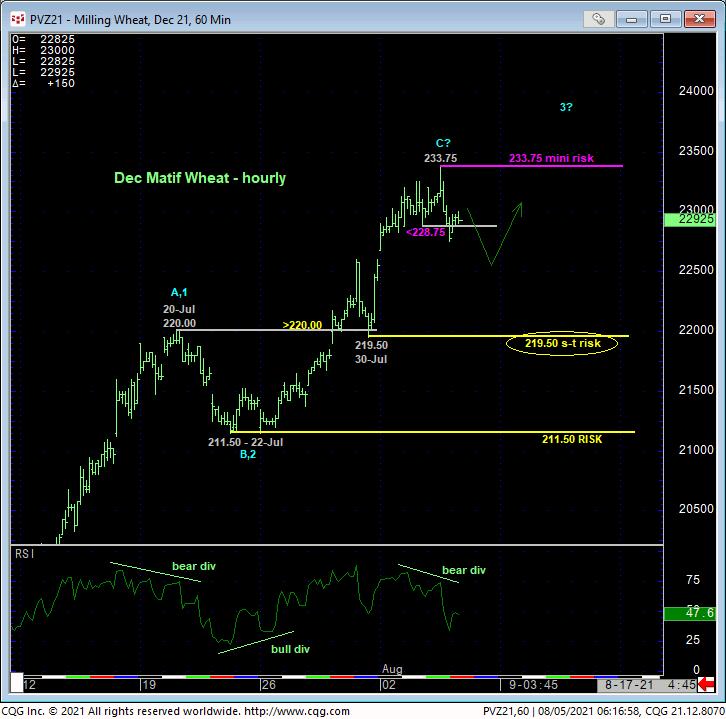
On the smallest of scales, the hourly chart below shows yesterday’s slip below Tue’s 228.75 minor corrective low confirming a bearish divergence in momentum. While the scale of this mo failure is too small to conclude anything more than another interim corrective dip within the major bull trend, this divergence nonetheless defines yesterday’s 233.75 high as one of developing importance and a new mini risk parameter this market is now required to recoup to reaffirm the major bull.

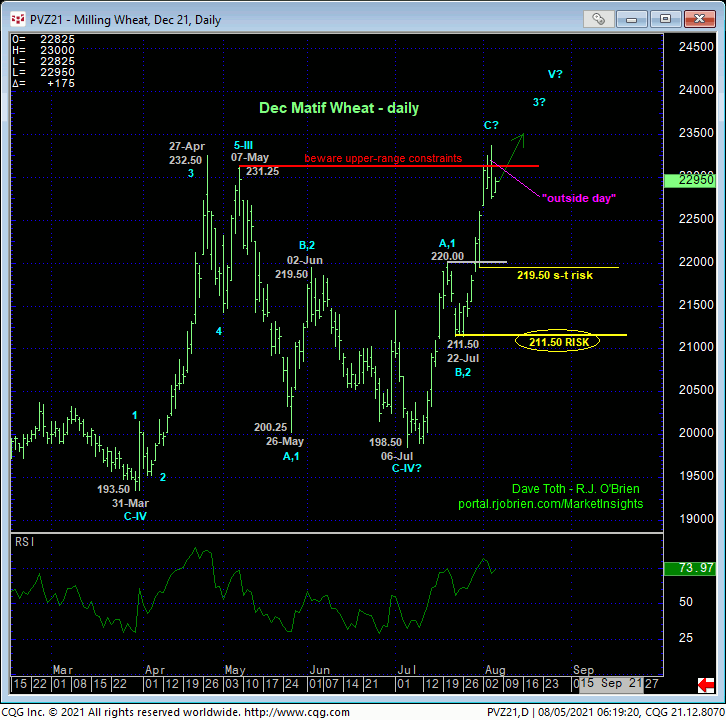
While from a pure momentum standpoint yesterday’s divergence is insufficient to conclude a top, the fact that it occurred in the immediate neighborhood of Apr and May’s obviously key highs and resistance around the 231-to-232-area should not be easily dismissed. Additionally, the daily chart below also shows an “outside day” down yesterday (higher high, lower low and lower close than Tue’s range and close).
These ancillary technical facts are insufficient to break the clear and present and major bull trend. But they are enough to warrant shoring up risk to still-advised bullish policy to more conservative levels. And in the hourly chart above and daily chart below, we’ve defined recent smaller- and larger-degree corrective lows at 219.50 and 211.50 as our new short- and longer-term risk parameters from which traders can and we believe should rebase and manage the risk of a still-advised bullish policy and exposure.


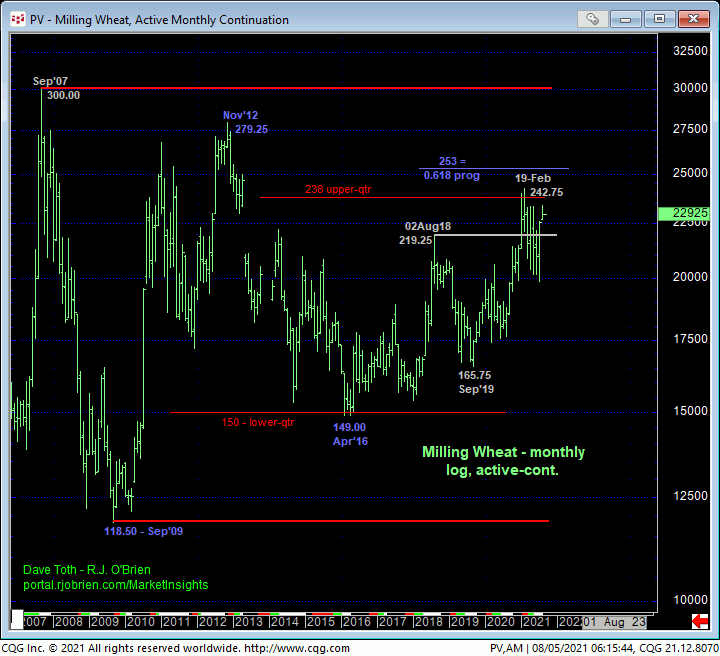
If our long-term bullish count calling the rally from 06-Jul’s 198.50 low the major 5th-Wave of a massive Elliott sequence up from Sep’19’s 165.75 low is wrong and this market is not on a tangent to blow away 2021’s highs ranging from yesterday’s 233.75 high in the Dec contract to 19-Feb’s 242.75 high in the then-prompt Mar contract, then, for the reasons listed above and given the market’s proximity to the upper-quarter of its historical range shown below, we would not be surprised by a rollover from the 232-233-area the market plucked at this week. If this long-term bullish count IS correct, then the market would be fully expected to sustain trendy, impulsive gains above recent corrective lows like 219.50 and certainly 211.50.
These issues considered, a bullish policy and exposure remain advised with a failure below 219.50 required for traders to pare or neutralize bullish exposure commensurate with their personal risk profiles and subsequent weakness below 211.50 required for long-term commercial players to move to the sidelines. In lieu of at least such sub-219.50 weakness, the minor setback resulting from yesterday’s mini mo failure is advised to first be approached as another correction within the secular bull trend ahead of further and possibly accelerated gains.


