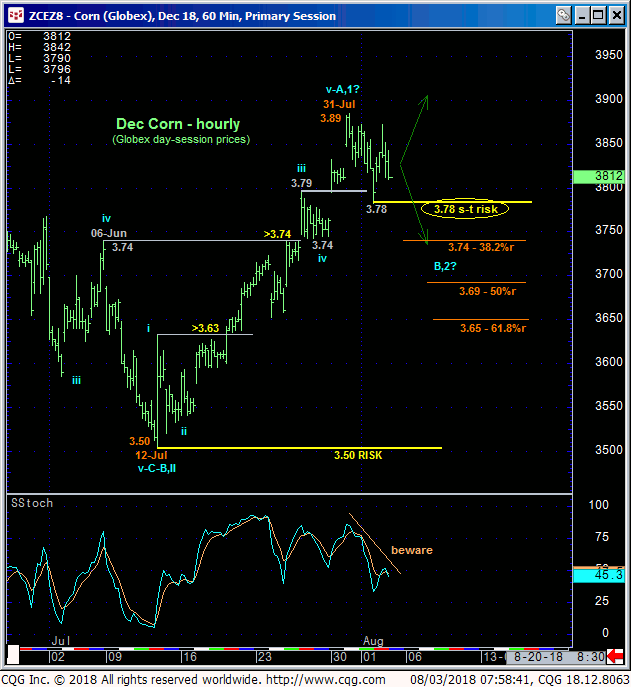
Similar to the scale issues we discussed in yesterday’s soybean Technical Blog and typical price action for broader base/reversal “processes”, shorter-term traders with tighter risk profiles are advised to consider Wed’s 3.78 low as our new short-term risk parameter from which non-bearish decisions like short-covers and bullish punts can be objectively rebased and managed. Waning upside momentum is obvious on this short-term scale and the prospect that Tue’s 3.89 high completed a 5-wave Elliott sequence up from 12-Jul’s 3.50 low is also clear. A break below that 3.78 low is needed to render it an “initial” counter-trend low, CONFIRM a bearish divergence in mo and establish at least the intermediate-term trend as down.


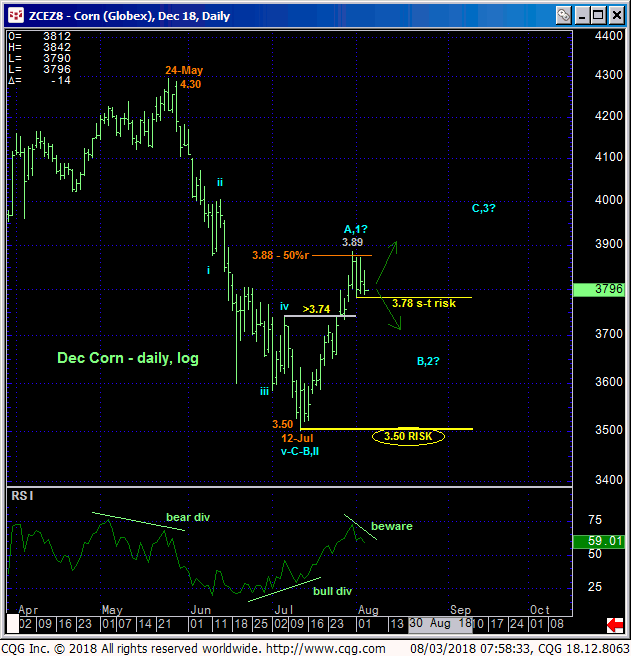
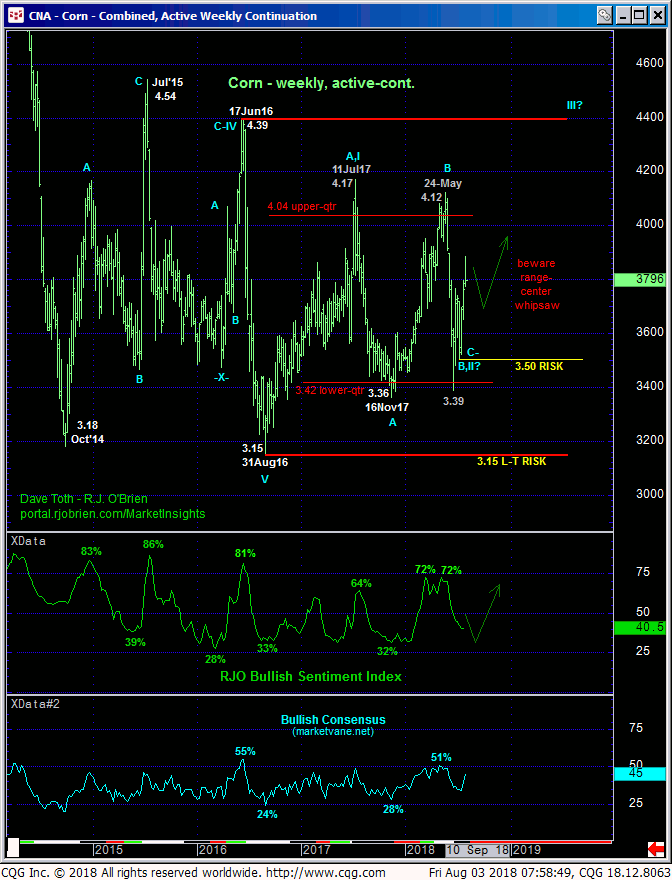
The fact that Tue’s 3.89 high is only a penny removed from the (3.88) 50% retrace of May-Jul’s 4.30 – 3.50 meltdown on a daily log scale basis above would seem to reinforce an interim peak/reversal-threat condition. However, the extent and impulsiveness of Jul’s rally maintains its status as just the initial (A- or 1st-Wave) salvo in a broader BASE/reversal environment that could be major in scope. And in this longer-term regard, any setback in the weeks ahead would be advised to first be approached as a (B- or 2nd-Wave) correction and BUYING OPPORTUNITY for long-term players.
In the hourly chart (top) we noted the 50% and 61.8% retracements of Jul’s rally at 3.69 and 3.65, respectively. A countering bullish divergence in momentum needed to stem that suspected corrective relapse and identify a specific, objective low and risk parameter could then present an outstanding risk/reward buying opportunity for the rest of the year.
These issues considered, a bullish policy remains advised with a failure below 3.78 required for both short- and longer-term traders to move to a neutral/sideline/or even cautious bearish position with subsequent strength above 3.89 required to negate that call, reinstate the uptrend and expose potentially sharp gains thereafter. We believe a sub-3.78 failure will expose a corrective relapse, possibly to the 3.69-to-3.65-area or lower, within a much broader BASE/reversal environment that ultimately will be approached as a long-term favorable risk/reward buying opportunity.


