Posted on Jul 26, 2023, 10:53 by Dave Toth
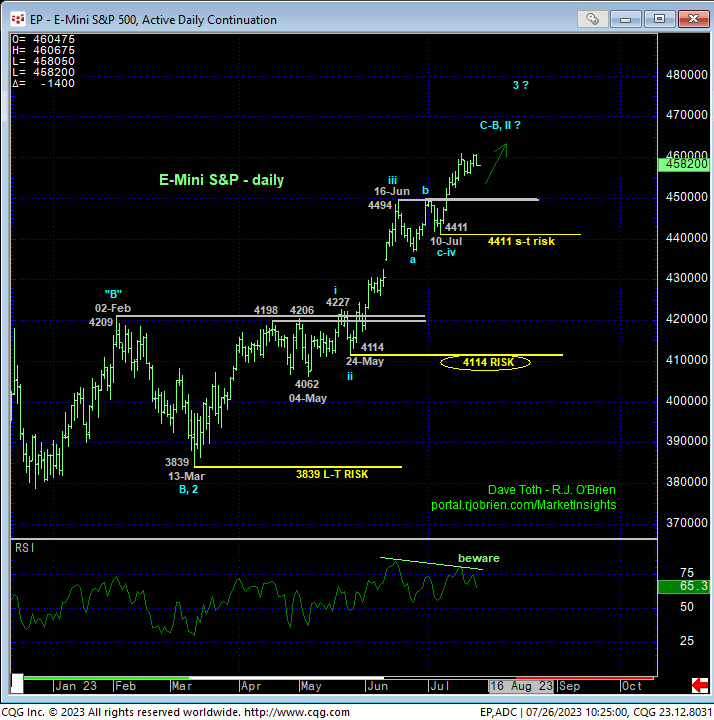
The extent of mid-Jul’s clear break above the 4494-to-4498-area that capped this market as resistance for nearly a month reaffirms the uptrend from last Oct’s 3502 low and leaves 10-Jul’s 4411 low in its wake as a relatively short-term low this market would be expected to sustain gains above per any broader and more immediate bullish count. Former 4494-to-4498-area resistance, since broken, would be expected to hold as a new near-term support candidate ahead of further and possibly steep gains. In this regard, this 4411 low is considered our new short-term but key parameter from which traders and even some investors can objectively rebase and manage the risk of a still-advised bullish policy and exposure.
A failure below 4411 will not be of a scale to conclude the end of the major rally from last Oct’s 3502 low, but rather only the portion of the uptrend from, we believe, 04-May’s 4062 low shown in the daily chart below. Such a sub-4411 failure would conclude what looks to be a textbook 5-wave Elliott sequence up from that 4062 low. Until and unless such sub-4411 weakness is shown however, the trend remains up on all practical scales and should not surprise by its continuance. For some longer-term reasons we’ll address below however, even longer-term investors should beware an admittedly short-term mo failure below 4411.

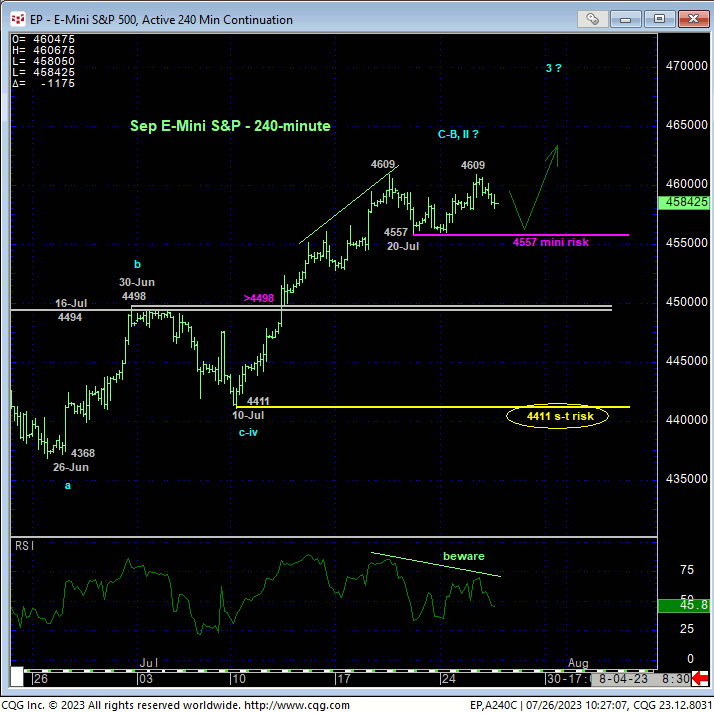
Drilling down a very short-term basis, the 240-min chart below clearly shows waning upside momentum over the past week or so that may come home to roost with this afternoon’s Fed announcement. A slip below last Thur’s 4557 low will confirm this divergence and define yesterday’s 4609 high as the end of the portion of the uptrend from 10-Jul’s 4411 low. Per such, this 4557 level is considered a mini parameter from which short-term traders can manage the risk of a bullish policy and exposure. A failure below 4557 will only be of a scale that will allow us to conclude an interim correction within the longer-term bull, with subsequent weakness below 4411 required to warn of greater downside vulnerability. This reminds traders of the importance of the technical and trading issue of SCALE.


The reasons 10-Jul’s 4411 relatively smaller-degree corrective low is important as a potentially key bull risk parameter from a longer-term perspective include:
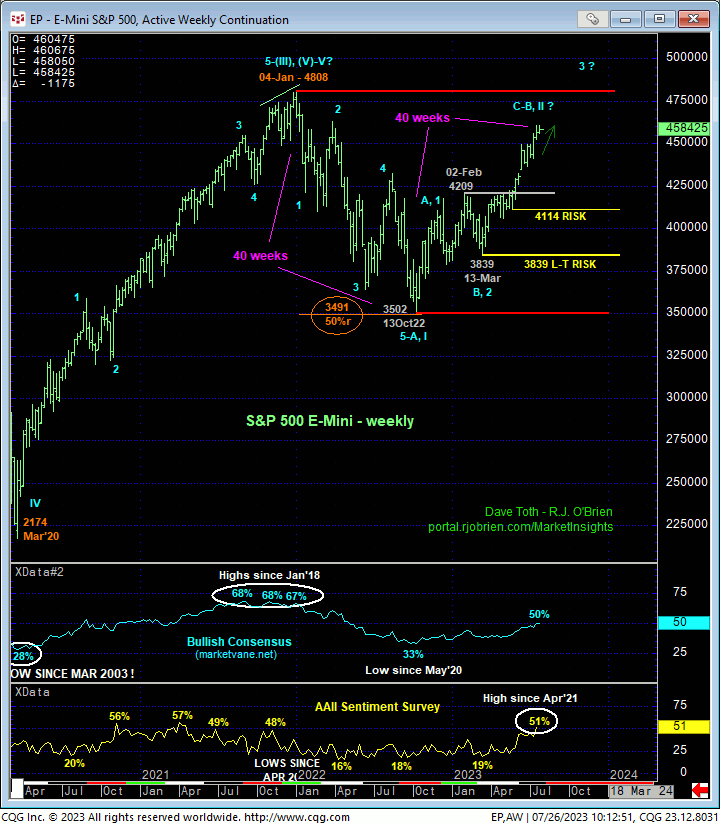
- the market’s engagement of the extreme upper recesses and prospective long-term resistance of the past year-and-a-half’s range shown in the weekly chart above
- the fact that last week marked the 4oth week of the recovery from last Oct’s 3502 low, mirroring last year’s 40-week decline
- the return to relatively frothy bullish sentiment/contrary opinion levels, and
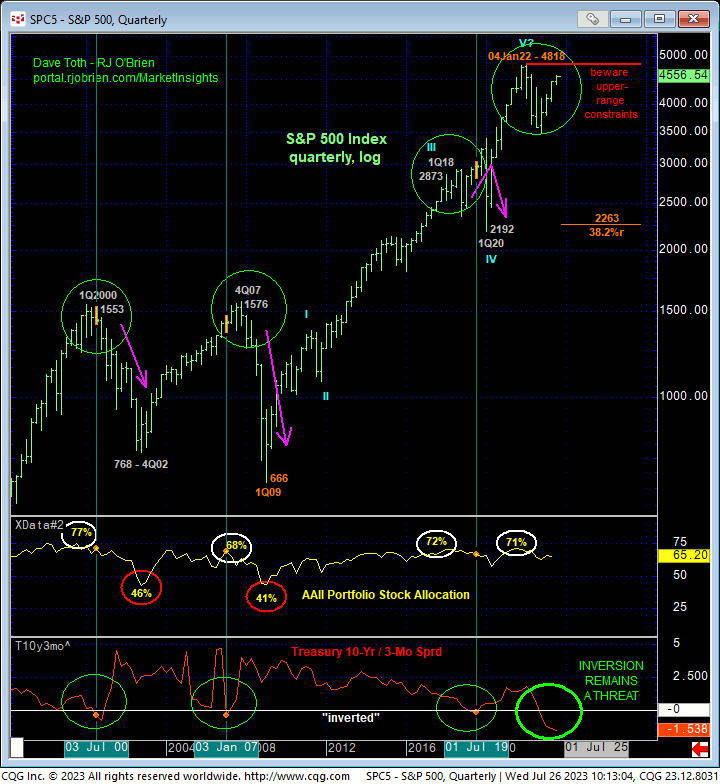
- the persistent Treasury yield curve inversion shown by the 10-yr/3-mo spread in the quarterly log scale chart of the S&P Index below.
NONE of these peak/reversal threat elements matter as long as the major but simple uptrend pattern of higher highs and higher lows remains intact. On a scale sufficient to jeopardize the impulsive integrity of a resumption of the secular bull market from last Oct’s 3502 low, commensurately larger-degree weakness below 24-May’s 4114 larger-degree corrective low and area below key former resistance-turned-support around the 4200-area remains required. BUT IF the market fails below 4411, what the market might have in store between 4411 and the 4200-area is anyone’s guess. Here again, the technical and trading matter of SCALE must be considered. If a trader or investor is not of a risk profile that can assume bull risk to 4114, the only closer, objectively bull risk parameter is 4411.
These issues considered, a bullish policy and exposure remain advised. Very short-term traders may want to use 4557 as a tight but objective risk parameter to a bullish policy. For most traders and investors however, a failure below 4411 is required to pare or neutralize exposure in order to circumvent the depths unknown of a larger-degree correction or possibly a significant reversal lower. In lieu of weakness below at least 4557 and preferably 4411, the trend remains up on all practical scales and should not surprise by its continuance. Beware “up here” however.


