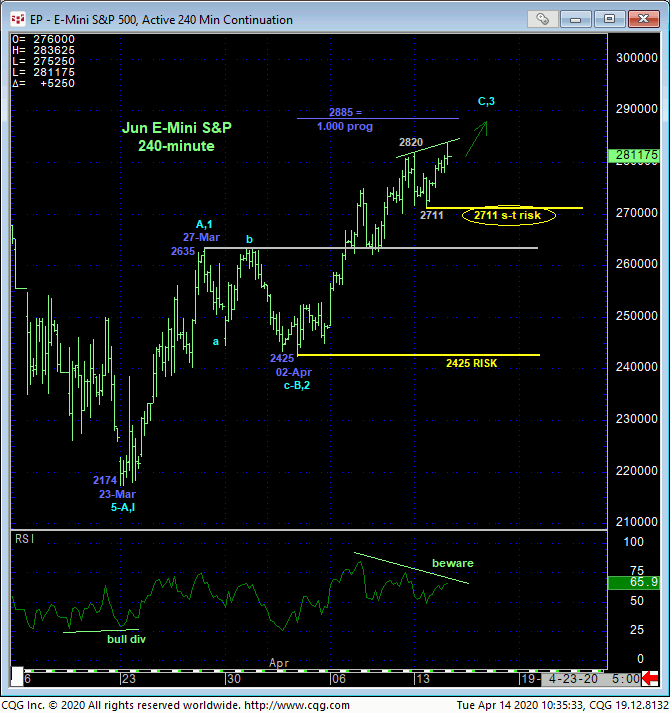
With today’s break above yesterday and Thur’s highs and resistance, the market has reaffirmed the developing recovery and our interim bullish stance once again. The important by-product of this continued strength is the market’s definition of yesterday’s 2711 low as the latest corrective low the market now needs to sustain gains above to maintain a more immediate bullish count. Its failure to do so will confirm a bearish divergence in short-term momentum that would allow us to conclude the END of the uptrend from at least 02-Apr’s 2425 next larger-degree corrective low and key risk parameter. Per such, we are identifying 2711 as our new short-term risk parameter to a still-advised bullish policy. and exposure.
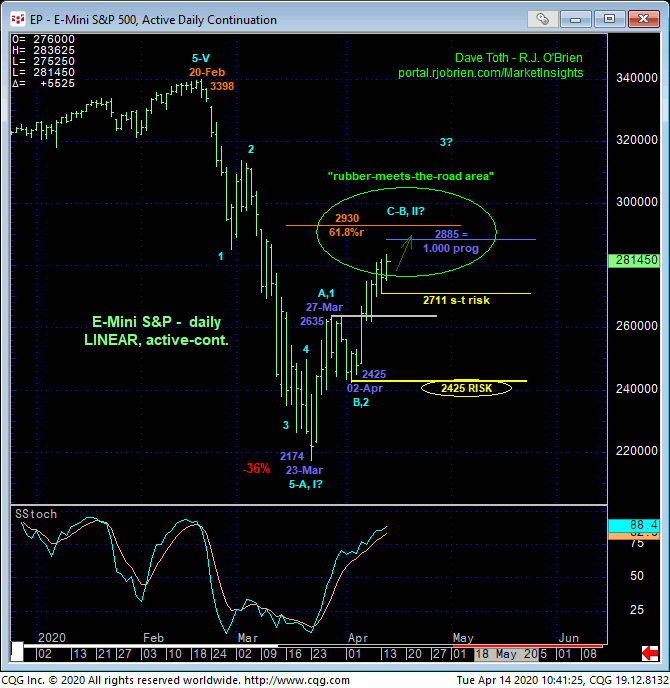
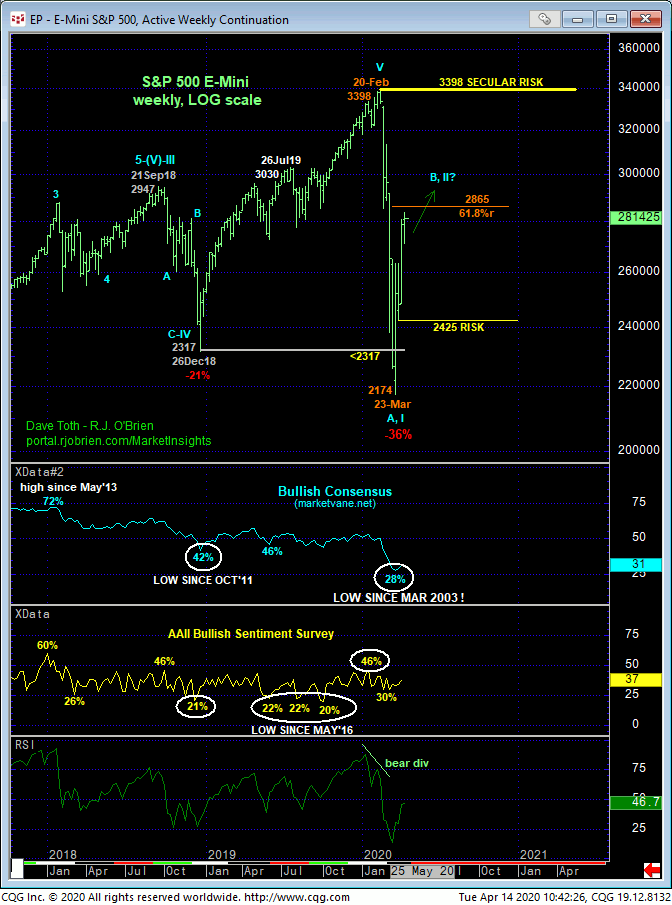
This tight but objective short-term risk parameter may come in handy as the market nears the Fibonacci retracement levels we introduced in 25-Mar’s Technical Blog were candidates for this suspected corrective rebuttal’s scope. In that 25-Mar blog and subsequent updates, we discussed the 61.8% retracements of Feb-Mar’s 3398 – 2174 collapse on both linear and logarithmic scales that cut across at 2930 (detailed in the daily linear chart above and 2865 on a log scale basis shown in the weekly log chart below. Additionally, the daily chart above shows that the (prospective C-Wave) rally from 02-Apr’s 2425 low will equal (i.e. 1.000 progression) late-Mar’s initial (suspected A-Wave) rally from 2174 to 2635 at 2885. These retracement and progression relationships identify an area we’re labeling our ‘rubber-meets-the-road area”.
TO BE CLEAR, we do NOT consider these merely derived technical levels as resistance. Such “derived technical levels” like trend lines, Bollinger Bands, imokus, the ever-useless moving averages and even the vaunted Fibonacci relationships we cite often have NEVER proved to be reliable reasons to to identify resistance (or support). And they never will because the derived technical level “tail” never, ever wags the underlying market “dog”.
But these relationships can contribute mightily to, in this case, a peak/reversal environment IF accompanied by a CONFIRMED bearish divergence in momentum needed to, in fact, stem the clear and present uptrend. Herein lies the importance of 02-Apr’s 2425 next larger-degree corrective low and key risk parameter needed to break Mar-Apr’s broader recovery and even yesterday’s 2711 smaller-degree corrective low. Until and unless the market proves weakness below these levels, there is no way to know that the current uptrend won’t simply continue or even accelerate.
If we’re supposed to remain bullish on this market “up here”, then it’s crucial for the bull to continue to prove itself with sustained, trendy, impulsive behavior higher, especially around this rubber-meets-the-road area around 2865-to-2930-area.
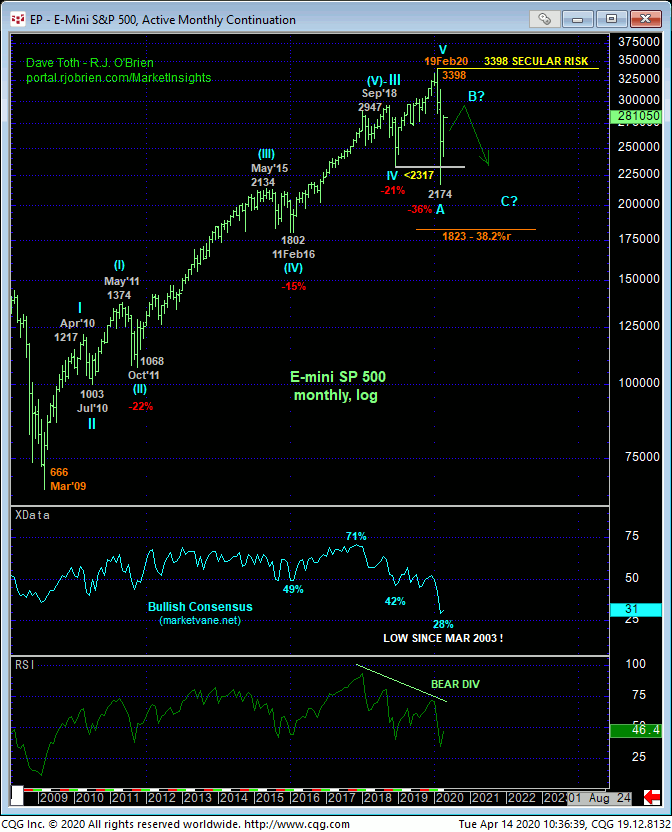
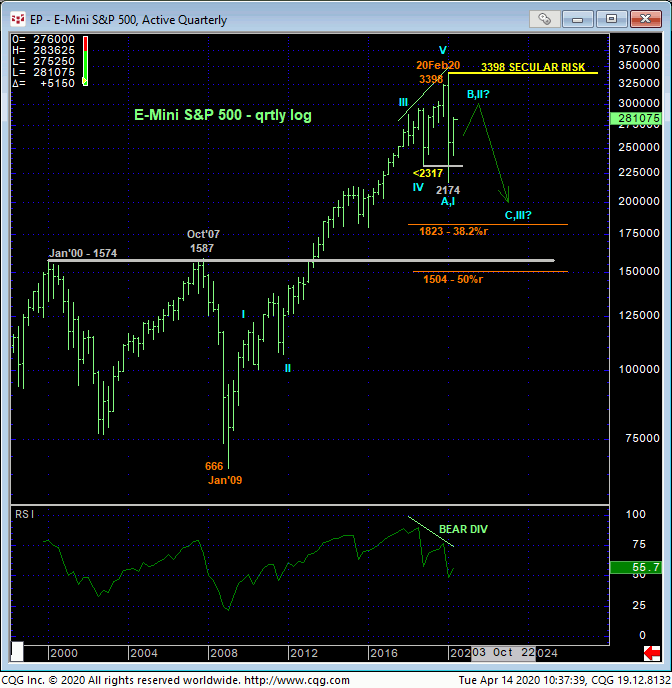
We’re alert to the ultimately bearish prospect and count that this current recovery may only be a correction within a massive peak/reversal environment because of:
- a confirmed bearish divergence in QUARTERLY momentum as a result of the market’s failure below Dec’18’s 2317 corrective low that
- leaves 20Feb20’s 3398 high in its wake as the END of a textbook 5-wave Elliott sequence that dates from Jan 2009’s 666 low as labeled below.
To nullify this bearish prospect, all the bull’s got to do is recoup 20-Feb’s 3398 high and new key secular risk parameter. Until and unless such 3398+ strength is proven, the prospect for a major peak/reversal process remains well intact and warns of protracted losses in terms of both price AND TIME. On this long-term scale, it is not hard to envision at least a multi-quarter or even multi-year correction that would not surprise with weakness anywhere between Mar’s 2174 low and huge former multi-year resistance-turned-support around the 1500-handle-area. To threaten or reduce the price depths of such a correction (although not necessarily a lengthier consolidation in terms of TIME), we believe the market needs to clearly break above this 2865-to-2930-area discussed above.
These issues considered, a bullish policy and exposure remain advised with a failure below 2711 required for shorter-term traders to move to the sidelines. Commensurately larger-degree weakness below at least 08-Apr’s 2620 corrective low is required for longer-term players to pare exposure to more conservative levels with a larger-degree failure below 2425 not only negating any bullish count and warranting its immediate cover, but also resurrecting a major peak/reversal environment that could produce protracted losses thereafter. In lieu of weakness below at least 2711, further and possibly accelerated gains should not surprise while keeping a keen eye on the 2865 – 2930-area.
