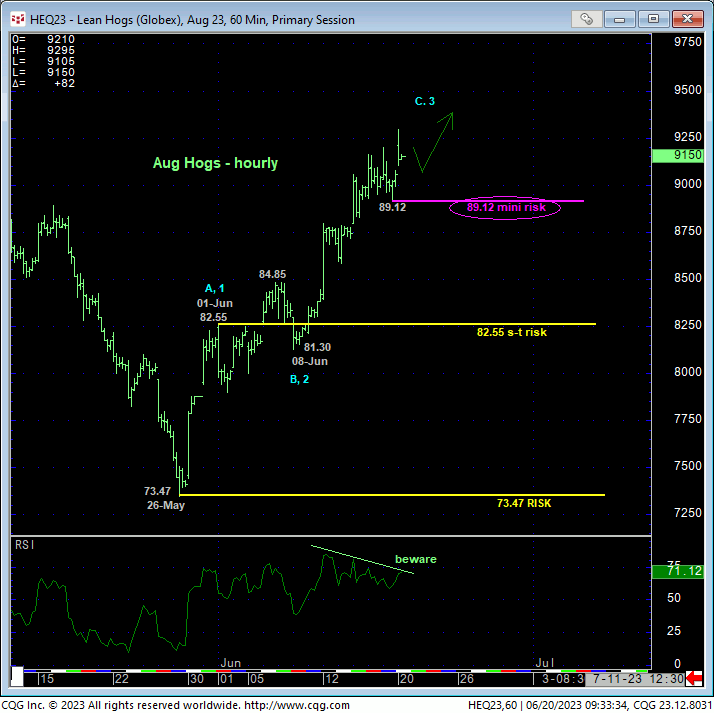
The hourly chart below of the now-prompt Aug contract shows today’s continued reversal above Fri’s 92.00 high. This chart also shows waning upside momentum on a very small scale, the bearish divergence of which would be confirmed if this market fails below Fri’s 89.12 latest smaller-degree corrective low. Against the backdrop of late-May/Jun ‘s sharp recovery, an admittedly very short-term momentum failure below 89.12 would NOT be of a scale sufficient to conclude the end of this impressive recovery. But because the extent and uninterrupted nature of the past week’s portion of this recovery left little in the way of consolidative battlegrounds that might now be looked to as support shy of the 84.85-to-82.55-area from early-Jun, we’re identifying 89.12 as our now mini but important and objective parameter from which to rebase and manage the risk of non-bearish decisions like short-covers and cautious bullish punts.
No, we will not be able to conclude a bigger correction or reversal lower if/when the market fails below 89.12. But we WOULD be able to conclude a rejected/defined high from which to objectively risk non-bullish decisions like long-covers and bearish punts as well as a level to require the market to then recover above to resurrect a broader bullish count.

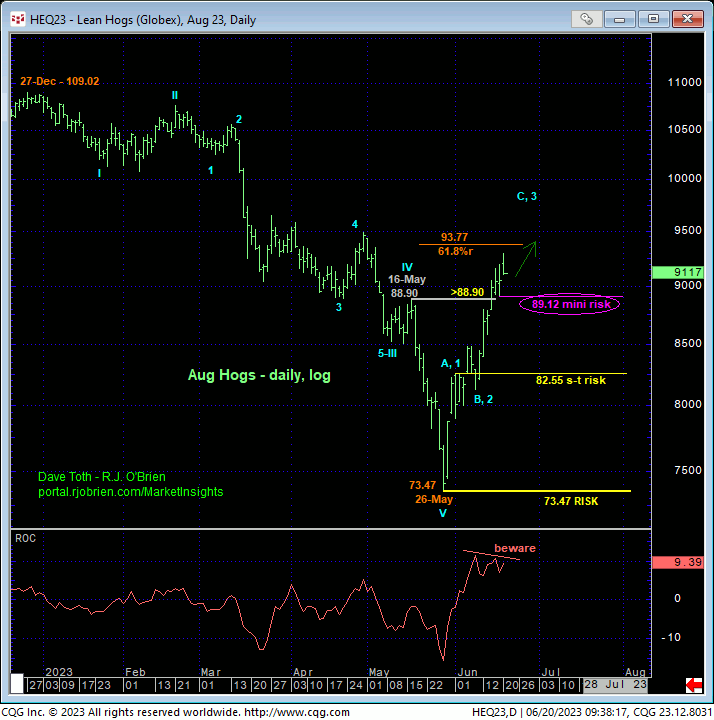
One of the reasons we urged traders to tighten bull risk to 89.12 is that a relapse below 01-Jun’s 82.55 initial counter-trend high is required to jeopardize the impulsive integrity of a broader bullish count, render the recovery from 26-May’s 73.47 low a 3-wave and thus corrective affair and re-expose the major bear trend. As this 82.55 level is back in the middle of the past month’s range, it is an impractical and sub-optimal level from which to base directional decisions. We believe it is preferable to acknowledge and accept whipsaw risk on an admittedly very short-term failure below 89.12 in exchange for steeper nominal risk below 82.55.
Another reason we suggest tightening up bull risk following last week’s sharp rally is that the daily log scale chart below shows the market’s near-61.8% retrace of its entire Dec-May 5-wave decline from 109.02 to 73.47. Given the extent and 5-wave nature of this year’s major downtrend, even the past few weeks’ impressive rally falls within the bounds of a possible correction.

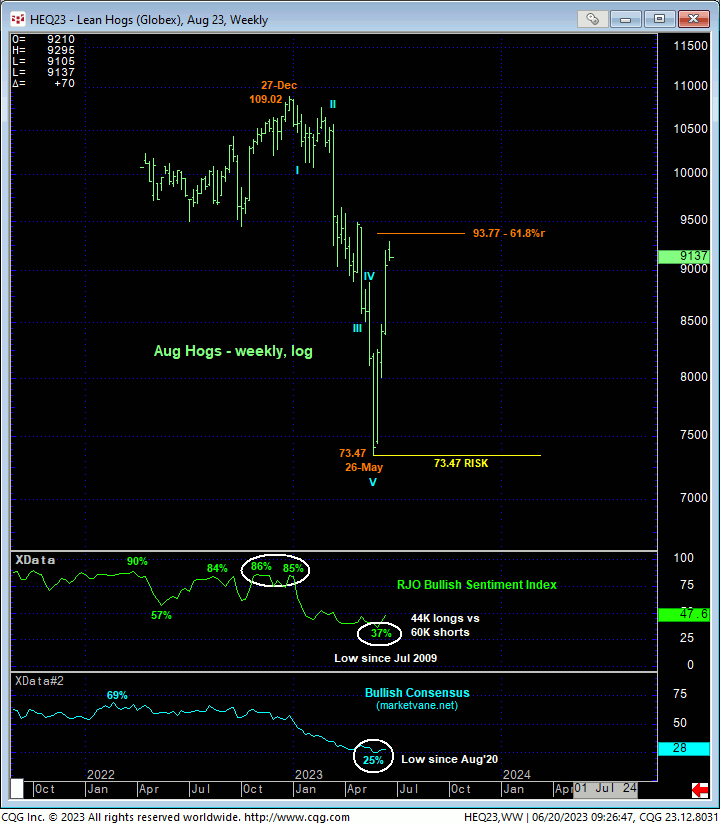
The weekly log chart of the Aug contract below also shows this (93.77) 61.8% retrace of this year’s meltdown as well as both measures of market sentiment/contrary opinion we monitor closely. Both the Bullish Consensus (marketvane.net) and our RJO Bullish Sentiment Index have recently posted multi-year lows that are typical of broader BASE/reversal environments, so we do not want to underestimate the extent to which this market might now be vulnerable to further and possibly long-term gains. But if such a broader bullish count is what this market has in mind, then it’s important for the bull to BEHAVE LIKE ONE by sustaining trendy, impulsive behavior higher. Again, a failure below 89.12 will not allow us to conclude a bigger relapse thereafter. But such a mo failure would at least define a more reliable high and resistance that we then could require the bull to exceed to mitigate a resuming long-term bearish count and reinforce a broader bullish count.


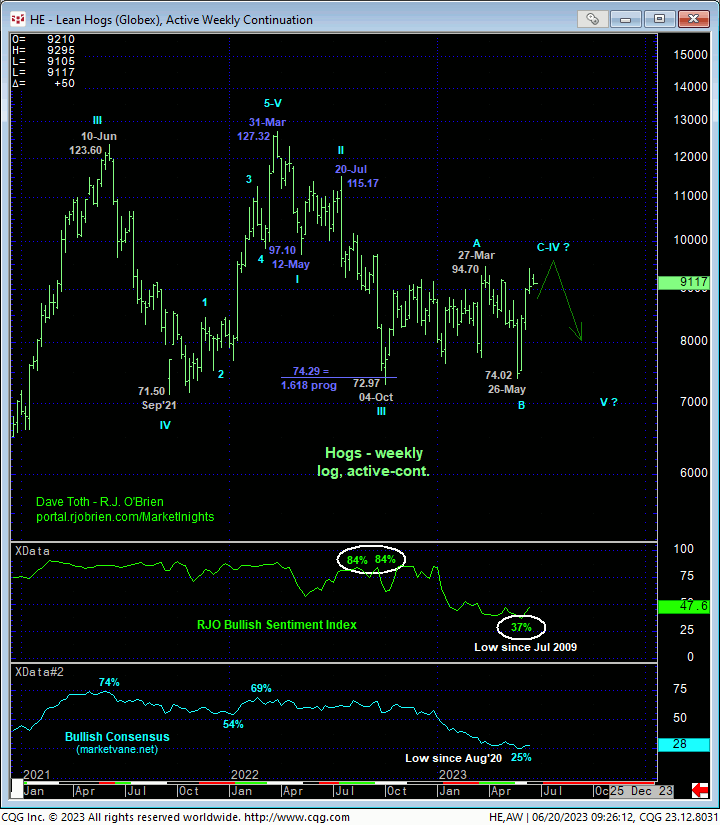
We remain suspicious about the recent rebound as, on an active-continuation basis, the weekly (above) and monthly (below) log scale charts show this recovery easily within the bounds of a corrective spasm within a broader bearish count down from Mar’22’s 127.32 high where al of the price action from 04Oct22’s 72.97 low fits the description of a mere bear flag consolidation pattern. We would also remind traders that in 14 of the past 15 years, this market has traded DOWN in the months following Jun.
Additionally, and as always discussed, the middle-half bowels of a major range are fertile ground for aimless whipsaw risk. Against the backdrop of the past 15-month decline, it would be premature to conclude this month’s smart rebound isn’t just another whipsaw. BUT IF IT IS, the market has to arrest the clear and present uptrend with a countering bearish divergence in momentum, even a smaller-degree one. Herein lies the importance of Fri’s 89.12 smaller-degree corrective low and mini risk parameter.
These issues considered a neutral-to-cautiously-bullish stance remains OK with a failure below 89.12 required to move to a neutral-to-cautiously-bearish stance with a subsequent recovery above whatever high is left in the wake of such a failure required to negate that call. In lieu of such sub-89.12 weakness, further lateral-to-higher prices are expected. In effect, we advise traders to toggle directional exposure around 89.12.


