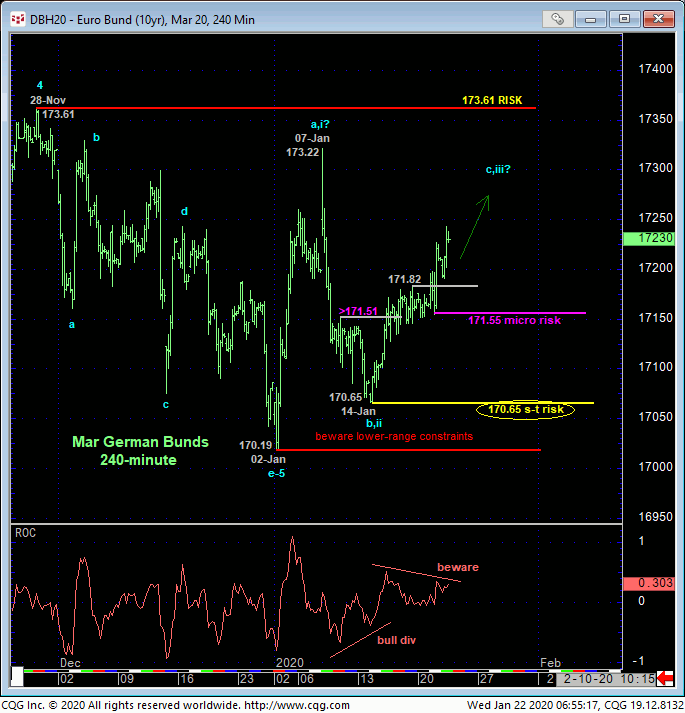
Yesterday’s continued, intra-range rebound above Fri’s 171.82 high reaffirms our interim bullish count introduced in 14-Jan’s Trading Strategies Blog and leaves yesterday’s 171.55 low in its wake as a very minor corrective low we believe the market should be required to sustain gains above to maintain a more immediate bullish count. Clearly, 15-Jan’s bullish divergence in short-term mo above 09-Jan’s 171.51 corrective high identifies 14-Jan’s 170.65 low one of developing importance, the end of the intra-range slide from 07-Jan’s 173.22 high and our new short-term risk parameter from which non-bearish decisions like short-covers and cautious bullish punts can be objectively based and managed. But given the backdrop of the past couple months’ lateral 170.19-to-173.61-range where the odds of aimless whipsaw risk are advised to be approached as higher from its middle-half, we believe a more conservative approach to risk assumption is warranted on recommended longs from 170.88, and yesterday’s 171.55 corrective low serves as exactly the type of tighter but objective risk parameter for this purpose.

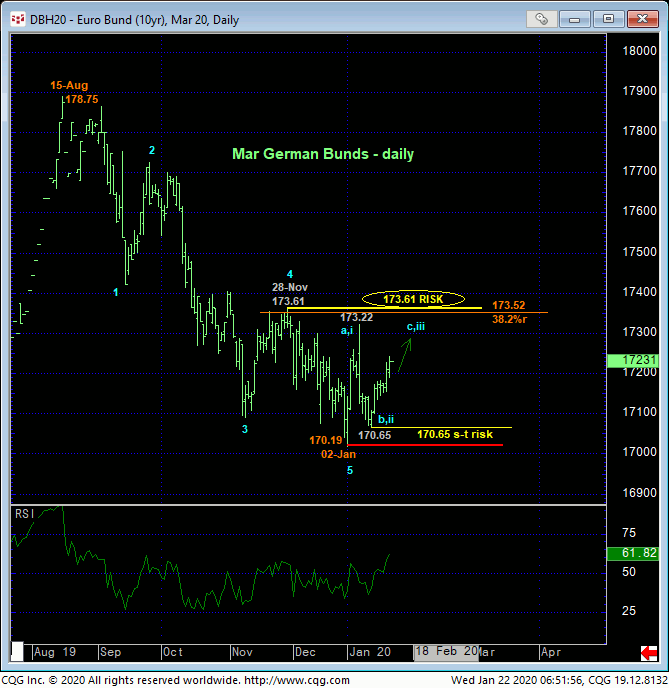
The daily chart below shows the market’s current position smack in the middle of the past couple months’ generally lateral range where the challenge remains of discerning a mere correction/consolidation of Aug-Jan’s 178.75 – 170.19 decline versus a base/reversal environment that could produce potentially steep gains above 28-Nov’s 173.61 larger-degree corrective high and key risk parameter. Such 173.61+ strength is required to, in fact, break this downtrend, confirm 02-Jan’s 170.19 low as the END of a (textbook) 5-wave Elliott sequence down from 178.75 and expose potentially steep gains thereafter. In effect, the market has identified 173.61 and 170.65 as the key directional triggers in the weeks ahead. We will be watchful for an intra-range rebound-stemming bearish divergence in short-term mo from the range’s upper-quarter to take profits on longs and prepare for another intra-range relapse as part of a broader corrective/consolidative count.

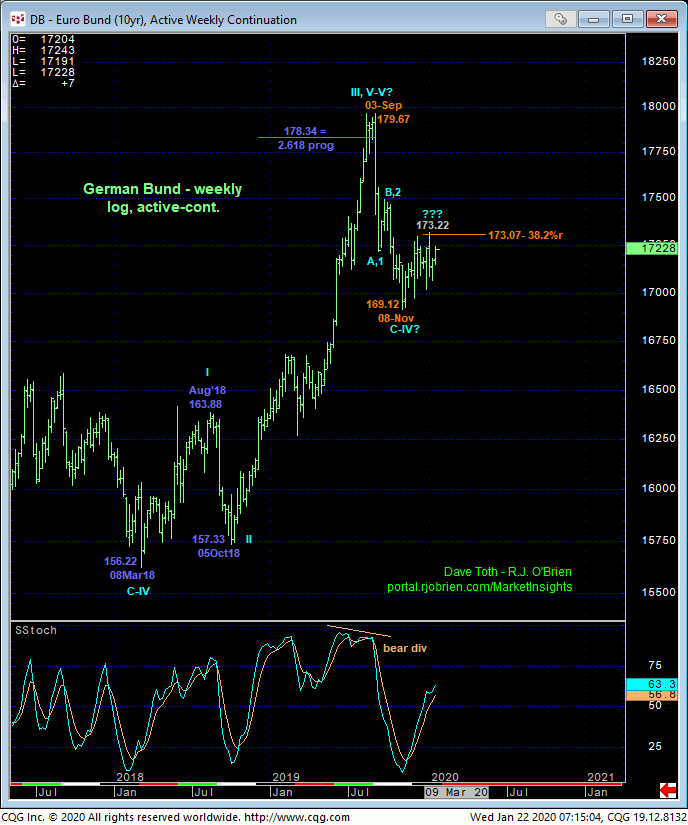
Finally, from a very long-term perspective, the magnitude of Oct’18 – Sep’19’s 157.33 – 179.67 rally on a weekly log active-continuation basis below maintains the prospect that the sell-off attempt from last year’s high may be just a (4th-Wave) correction ahead of a (5th-Wave) resumption of the secular bull. Before considering such a bullish count more seriously however, proof of strength above at least our key risk parameter at 173.61 is required. Above that flexion point however, the market’s upside potential could surprise and should not be underestimated.
These issues considered, a cautious bullish policy and exposure from 170.88 and/or 171.52 remains advised with a failure below 171.55 required to threaten this call enough to warrant its cover and move to a neutral/sideline position. In lieu of such sub-171.55 weakness, we anticipate continued gains to the upper-quarter of the 173.61 – 170.19 range where a bearish divergence in short-term mo will present a favorable risk/reward opportunity from the bear side. A break above 28-Nov’s 173.61 larger-degree corrective high and key risk parameter however will break Aug0-Jan’s downtrend and expose a correction or reversal higher that could produce protracted, indeterminable gains thereafter.


