Posted on Feb 28, 2023, 06:14 by Dave Toth

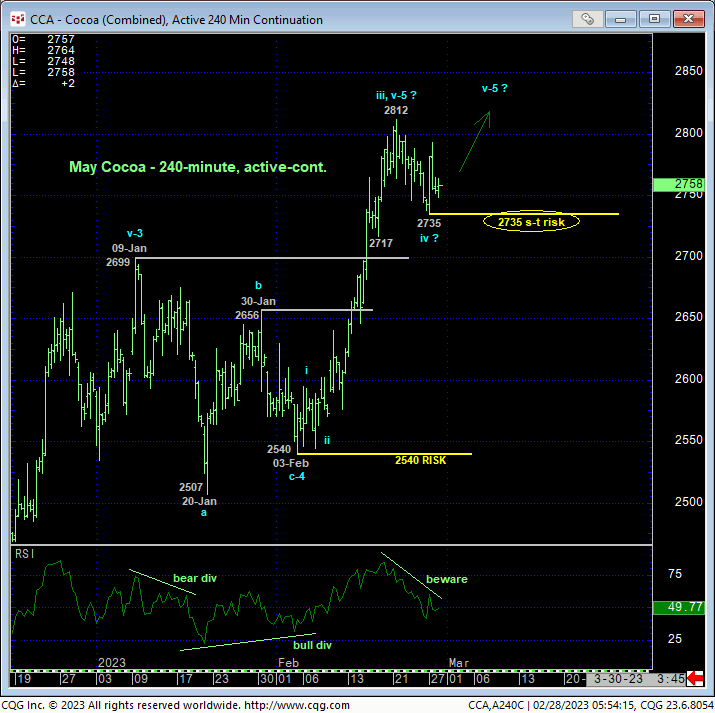
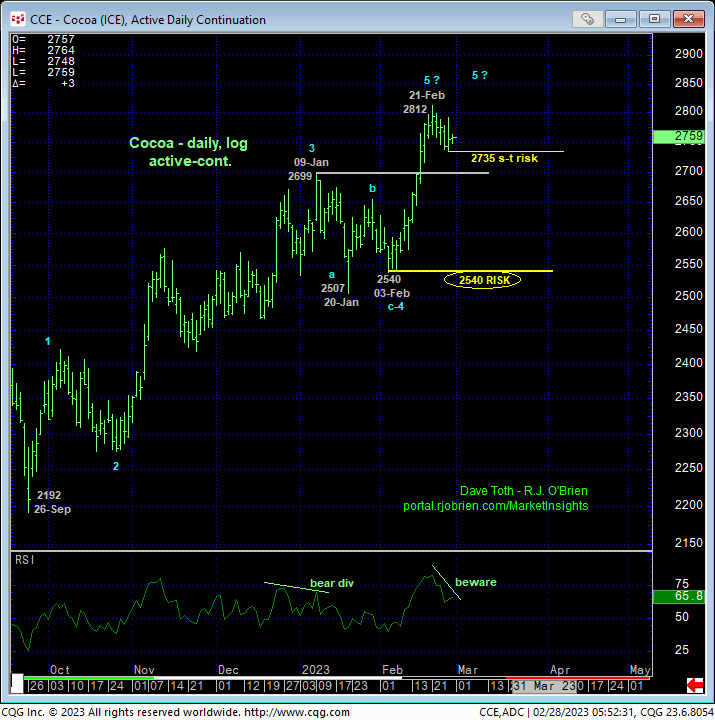
Only a glance at the 240-min chart above and daily log chart below is needed to see that upside momentum has been waning over the past week. Per such, we advise shorter-term traders to trail short-term bull risk assumption from 16-Feb’s 2717 low to yesterday’s 2735 low, the failure below which will render that low an initial counter-trend low and confirm a bearish divergence in momentum. Such a sub-2735 failure will still leave the market above a relative ton of former resistance-turned-support from the 2699-to-2656-area that capped this market from late-Dec until mid-Feb’s breakout and thus a still-arguable smaller-degree (4th-Wave) correction within the broader bull trend. But “up here”, at the extreme upper recesses of this market’s FIVE-YEAR lateral range that has repelled every other rally attempt over this time, shorter-term traders are urged to be as tight with bull risk as is objectively possible.
The prospect that the rally from 03-Feb’s 2540 low is the completing 5th-Wave of an Elliott sequence from 26-Sep’s 2192 low would contribute to such a broader peak/reversal-threat process. This said, commensurately larger-degree weakness below 03-Feb’s 2540 larger-degree corrective low remains required to confirm this count to the point of non-bullish action by long-term commercial players. Indeed, we cannot confirm a major peak/reversal threat from proof of only short-term weakness below a level like 2735.


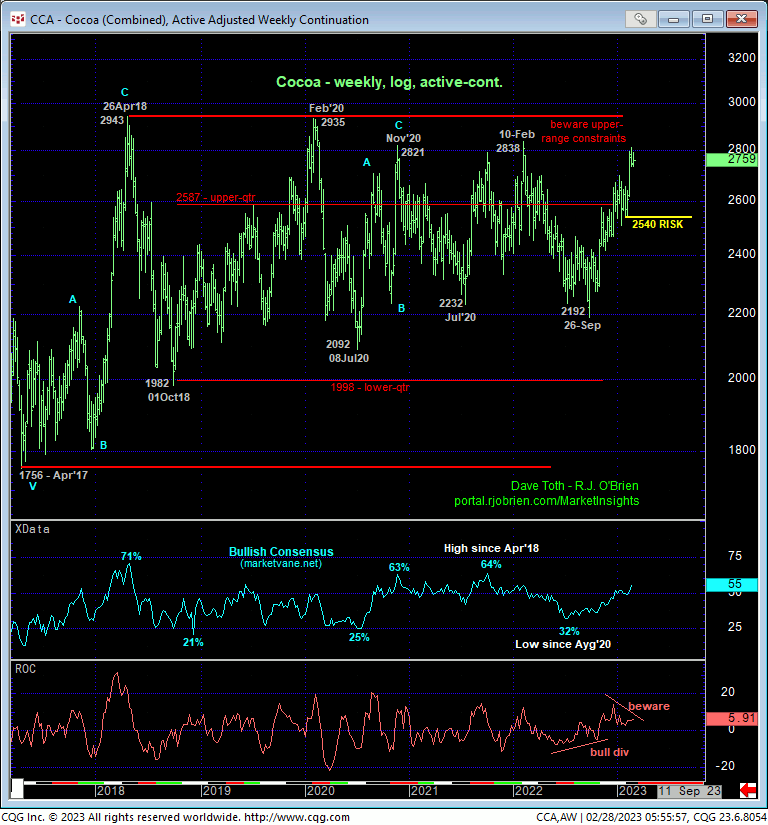
The weekly log active-continuation chart above shows this market’s proximity to the upper-quarter of its incessant 5-year range that has repelled every other rally attempt over this time span, and markedly so. But to repeat such an episode, the market needs to break the clear and present uptrend. And we will gauge such a break precisely around two levels at this juncture: 2735 and 2540. Until and unless these levels are broken, and the market satisfies our three key reversal requirements of:
- a confirmed bearish divergence in momentum
- proof of impulsive 5-wave behavior down and
- proof of 3-wave corrective behavior on a subsequent recovery attempt,
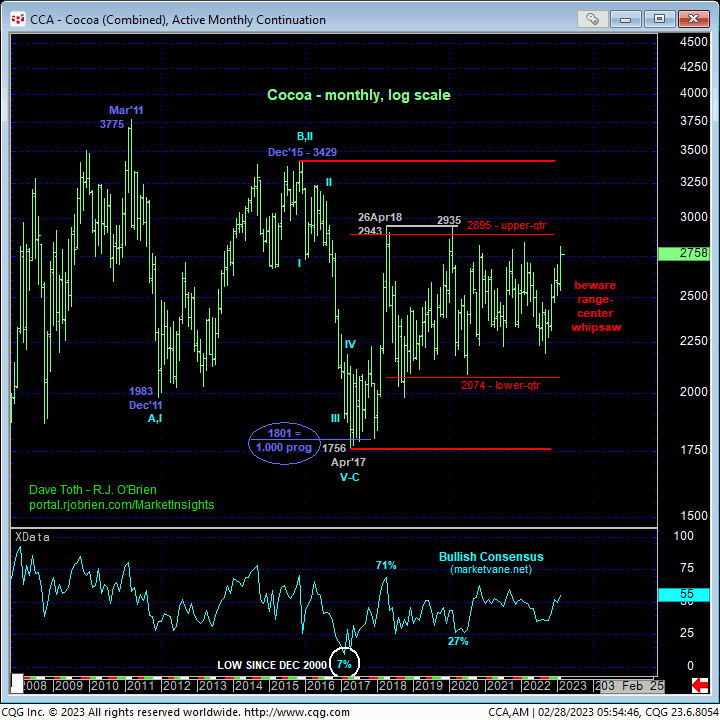
this uptrend should not surprise by its continuance or acceleration. Indeed, on an even longer-term monthly log basis below, the past five years’ lateral chop is a middle-half subset of an even broader 15-YEAR lateral range that is arguably corrective/consolidative ahead of an eventual resumption of 2017 – 2018’s uptrend that preceded it to 3000+ levels.
These issues considered, a bullish policy and exposure remain advised with a failure below 2735 required for short-term traders to move to a neutral/sideline position and for even longer-term commercial players to pare bullish exposure to more conservative levels. In lieu of at least such sub-2735 levels, further and possibly accelerated gains remain anticipated.


