DEC CORN
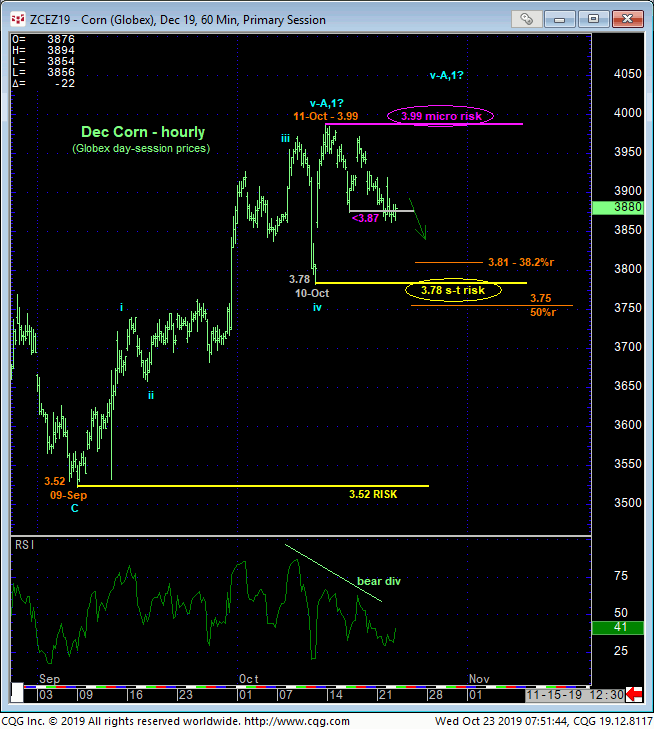
Yesterday’s break below 16-Oct’s 3.87 initial counter-trend low confirms a bearish divergence in very short-term momentum. This mo failure defines 11-Oct’s 3.99 Globex day-session high as one of developing importance and a new micro risk parameter from which short-term traders can objectively base non-bullish decisions like long-covers and cautious bearish punts.
Only a glance at the hourly chart below is needed to see the prospect that that 3.99 high completed a 5-wave Elliott sequence from 09-Sep’s 3.52 low, but a failure below 10-Oct’s 3.78 corrective low and short-term risk parameter remains required to CONFIRM this count. Per such, this 3.78 level remains intact as our short-term risk parameter to a still-advised bullish policy for intermediate-term traders.
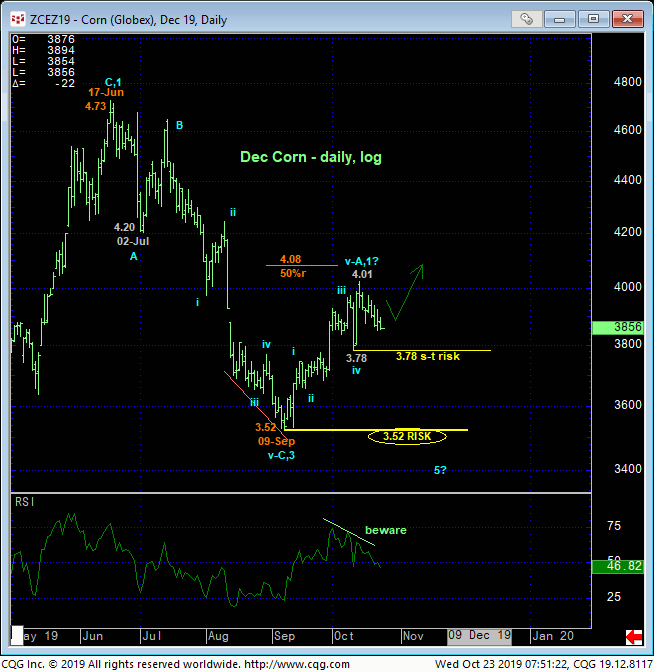
Taking a step back, it’s easy to see waning upside momentum this month in the daily log chart above, but again, a failure below 10-Oct’s 3.78 corrective low remains required to CONFIRM the signal to the point of non-bullish action like short-covers. Such a mo failure will, in fact, break Sep-Oct’s uptrend and expose at least an interim corrective rebuttal to the 3.52 – 4.01 rally.
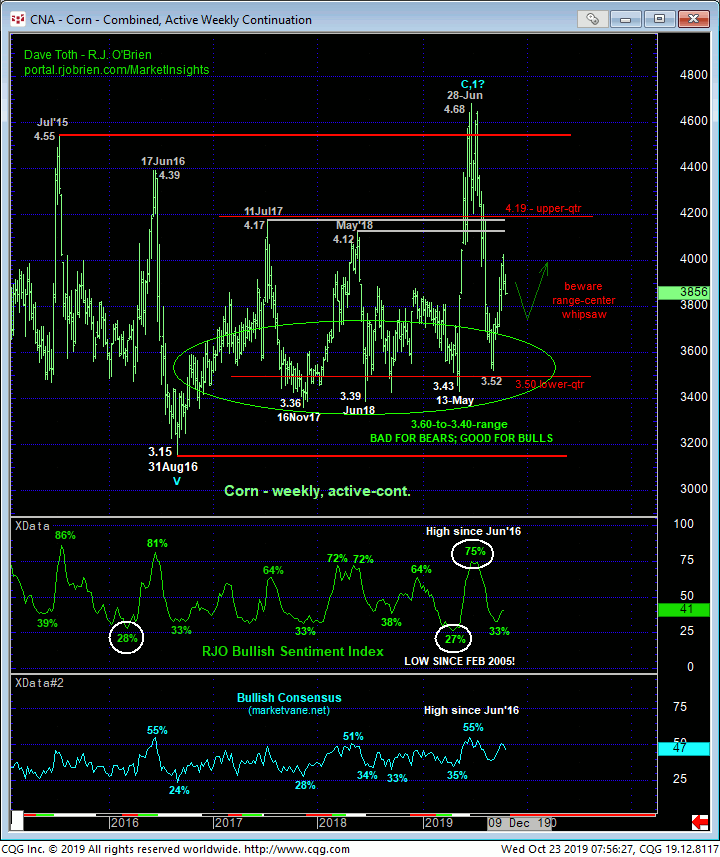
Complicating matters further is the market’s position back in the middle or the middle-half bowels of the past FIVE YEARS’ lateral range where we never underestimate the odds for aimless whipsaw risk that we believe requires a more conservative approach to risk assumption. Such an approach puts an emphasis on tighter but objective parameters like 3.99 and 3.78 that traders can use to effectively manage the risk of range-center directional decisions.
These issues considered, shorter-term traders are advised to use 3.99 and/or 3.78 as their new short-term risk parameters around which to base non-bullish decisions like long-covers and cautious bearish punts. Longer-term players remain advised to maintain a bullish policy, but to pare bullish exposure to more conservative levels on a failure below 3.78. Needless to say, a recovery above 3.99 reaffirms our major base/reversal count and exposes further and potentially steep gains thereafter.
NOV SOYBEANS
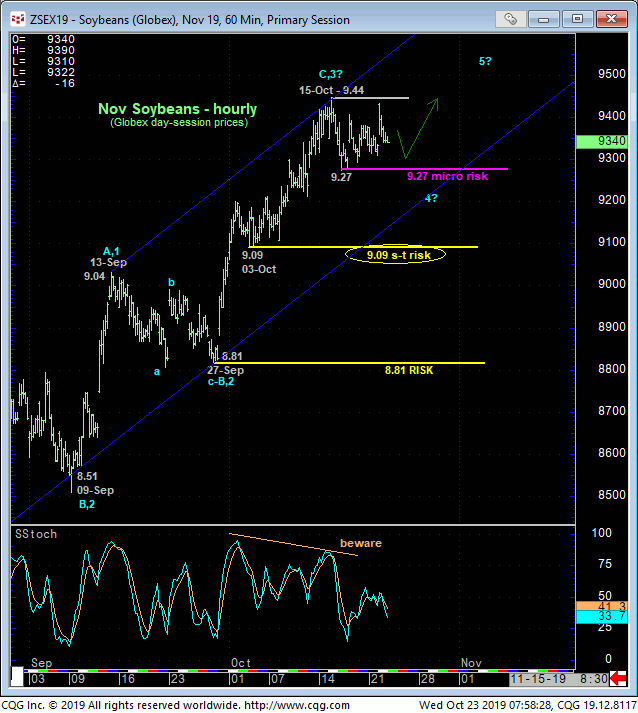
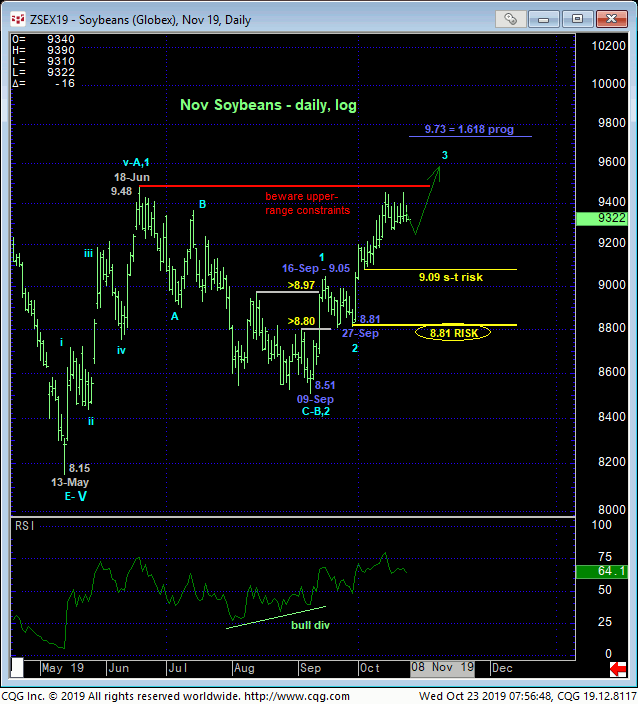
Similarly, the combination of waning upside momentum on a short-term basis detailed in the hourly chart above from the extreme upper recesses of the past four-month range shown in the daily log chart below warns of an interim correction lower that would be pertinent to shorter-term traders if the market breaks 16-Oct’s 9.27 initial counter-trend low and confirms this bearish divergence in very short-term mo. From a longer-term perspective, commensurately larger-degree weakness below 03-Oct’s 9.09 corrective low remains required to threaten the broader uptrend.
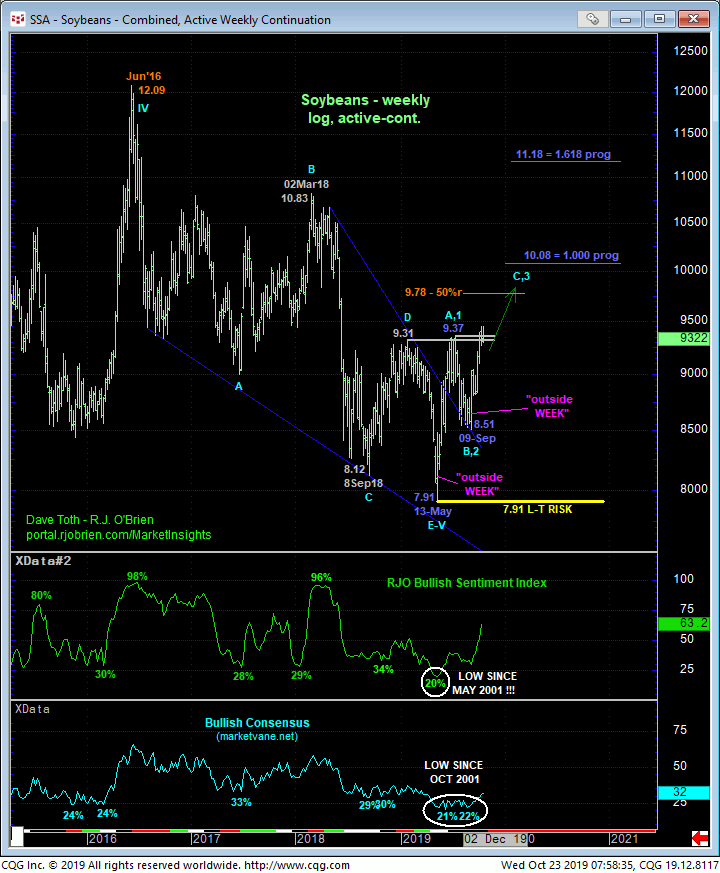
On an even broader weekly log scale below, our major base/reversal count remains intact and warns of potentially huge gains in the months ahead. Integral to this long-term bullish count is, as usual, historically bearish sentiment/contrary opinion levels. Our RJO Bullish Sentiment Index has recovered as a result of the past few weeks’ rally, but this indicator has done its job of warning of a base/reversal environment. The Bullish Consensus (marketvane.net) however remains at historically depressed levels DESPITE MONTHS of base/reversal-threat behavior. We believe this stubborn bearishness warns of a vulnerability to higher prices.
In sum, a bullish policy remains advised with a failure below 9.27 sufficient for short-term traders to pare or neutralize bullish exposure in order to circumvent the depths unknown of what we’d suspect is just another interim corrective relapse. A bullish policy remains advised for long-term players with a failure below at least 9.09 required to take defensive measures. Needless to say, a break above last week’s 9.44 high reinforces a bullish count and exposes further and possibly accelerated gains thereafter.
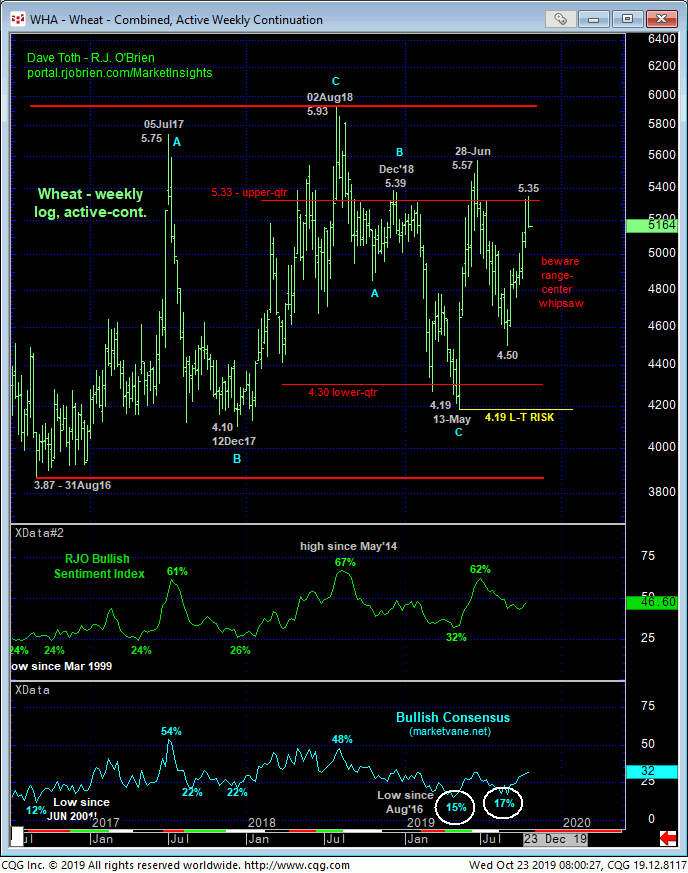
DEC WHEAT
Yesterday’s failure below a minor corrective low at 5.20 from last Thur confirms a bearish divergence in very short-term momentum as detailed in the hourly chart below. This failure defines Mon’s 5.35 high as one of developing importance and our new micro risk parameter from which any non-bullish decisions like long-covers and cautious bearish punts can now be objectively based and managed.
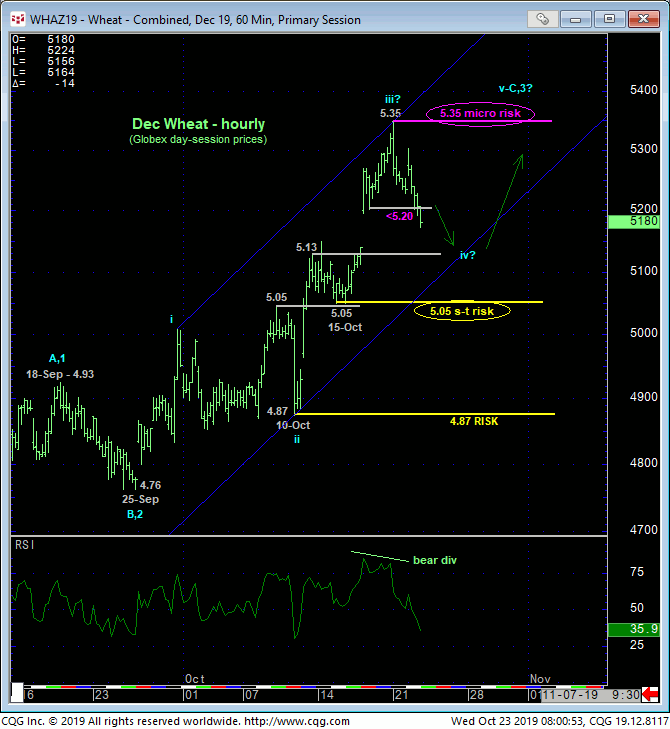
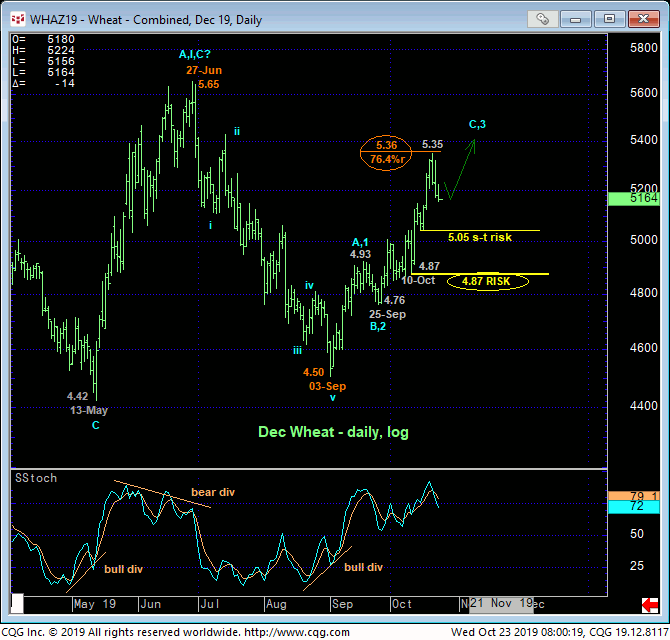
Needless to say, this mo failure is of too minor a scale to conclude anything more than another interim corrective dip at this juncture. However, the fact that this admittedly micro mo failure stems from the (5.36) 76.4% retrace of Jun-Sep’s 5.65 – 4.50 decline and the (5.33) upper-quarter of the multi-year lateral range warns us not to ignore the prospect of a more considerable, if intra-range corrective relapse.
These issues considered, shorter-term traders with tighter risk profiles are advised to pare or neutralize bullish exposure to circumvent the depths unknown of an intra-range correction lower. A recovery above 5.35 is required to negate this call, reinstate the bull and expose potentially sharp gains thereafter. A bullish policy remains advised for longer-term players with a failure below 5.05 required to defer or threaten this call enough to warrant moving to the sidelines as, at that point, the market would have reverted to the middle-half of the incessant multi-year range where our biggest challenge will then be aimless whipsaw risk.
