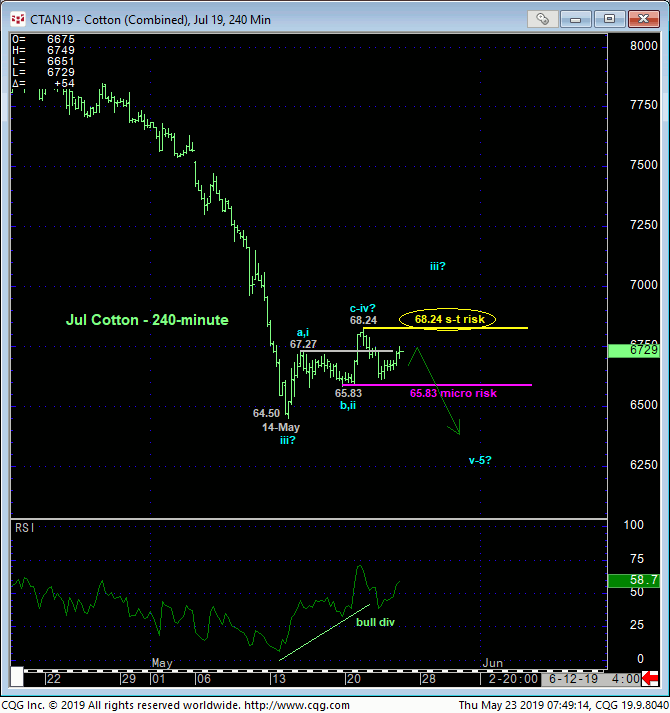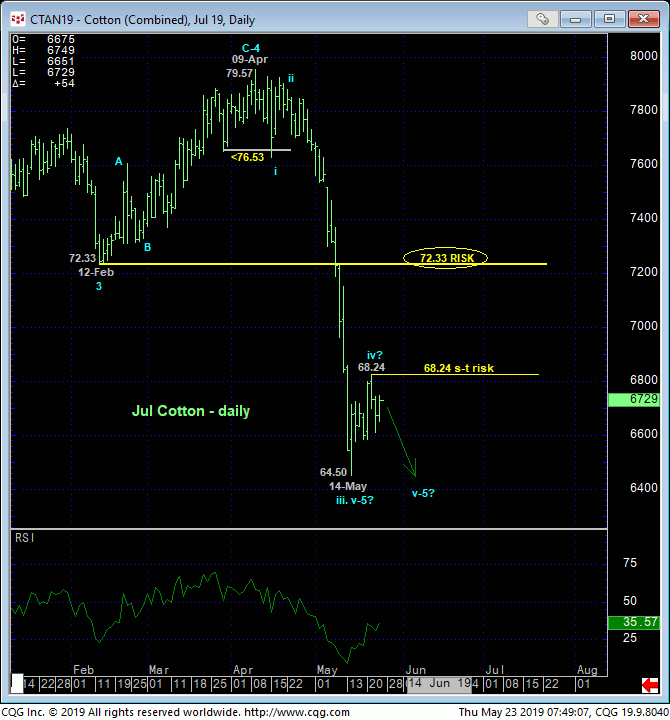

On the smallest of scales Mon’s recovery above 15-May’s 67.27 initial counter-trend high confirms a bullish divergence in very short-term momentum as detailed in the 240-min chart above. But against the backdrop of Apr-May’s preceding collapse, this momentum failure is of too small a scale to conclude anything more than an interim (4th-Wave) corrective hiccup ahead of resumed (5th-Wave) losses. This could even be the case if the market continues its recovery above Tue’s 68.24 high. But traders are nonetheless advised to pare or neutralize bearish exposure on such 68.24+ proof of strength because of 1) historically bearish sentiment conditions that could leave the market vulnerable to a steeper recovery and 2) the uninterrupted nature of late-Apr/early-May’s meltdown that level nothing in the way of former consolidative battlegrounds that now may be looked to as resistance candidates.
A relapse below 17-May’s 65.83 low and micro risk parameter will confirm this recent recovery attempt as a 3-wave and thus corrective affair that would re-expose the downtrend to new lows below 64.50.


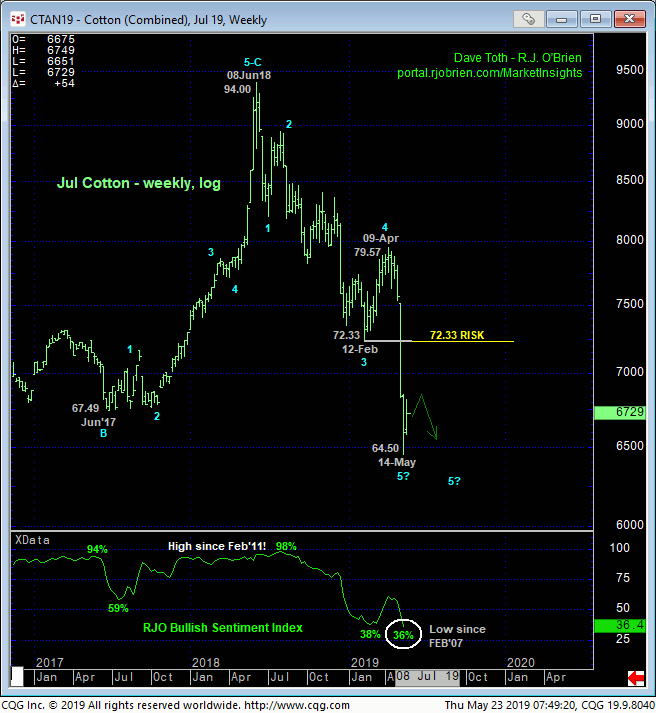
Only a glance at the weekly chart below is needed to see that the downtrend remains as the dominant technical factor currently. However, our RJO Bullish Sentiment Index of the hot Managed Money positions reportable to the CFTC has eroded to a 12-YEAR low at 36%. As long as the downtrend remains intact, this is of no matter as market sentiment/contrary opinion is not applicable as a technical tool But the moment the market does something to threaten the downtrend and reject/define a more reliable low and support, then that historically bearish sentiment condition is applicable as a tool that warns of a vulnerabilityto higher prices.
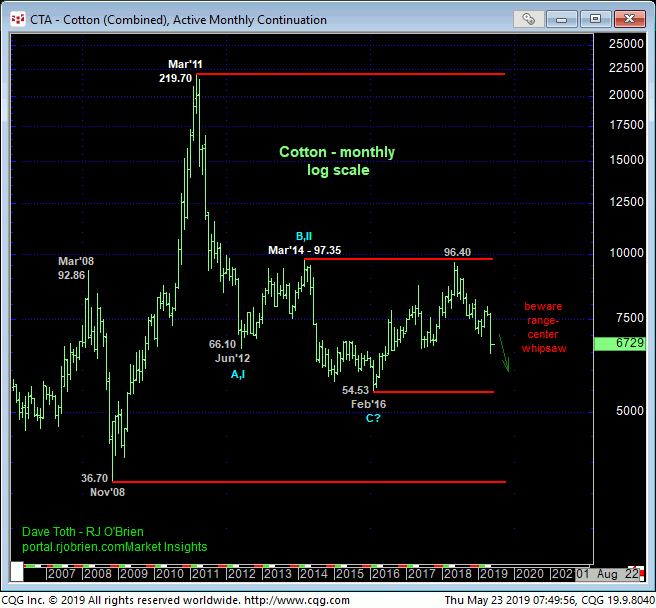
Another fact that warns us to keep a keen eye on tighter but objective risk parameters is the market’s position in the middle-half of the 7-YEAR range shown in the monthly log chart below. Such range-center conditions are fertile ground for aimless whipsaw risk that warrants a more conservative approach to risk assumption. Hence the importance of Tue’s 68.24 admittedly tight risk parameter. If the market pokes above 68.24, we’re basically recommending accepting whipsaw risk rather than larger nominal risk to 12-Feb’s 72.33-area of key former support-turned-resistance and a level the market shouldn’t come even close to per any broader bearish count.
These issues considered, a bearish policy remains advised with a recovery above 68.24 threatening this count enough to warrant a move to the sidelines by shorter-term traders with tighter risk profiles and for long-term players to pare bearish exposure to more conservative levels to reduce or eliminate the heights unknown of a steeper correction or reversal higher. A relapse below 65.83 will render the recent pop a 3-wave and thus corrective structure and warn of the bear’s resumption to new lows below 14-May’s 64.50 low.

%MCEPASTEBIN%

