Posted on Aug 17, 2022, 07:21 by Dave Toth
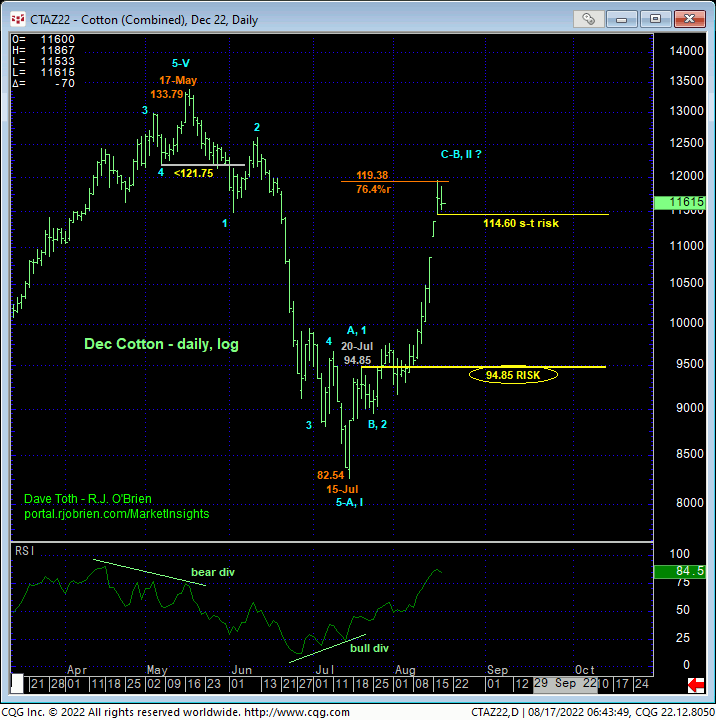
While this month’s price spike obviously reinforces our base/correction/recovery count introduced in 27-Jul’s Technical Blog, the challenge of navigating a prospective top after such a steep, uninterrupted spike is identifying smaller-degree corrective lows around which to tighten bull risk and walking that whipsaw-correction-vs-reversal tightrope. After such a windfall however and as we’ll detail below, we’re erring on the side of a more conservative approach to risk assumption and acknowledging and accepting whipsaw risk in exchange for deeper nominal risk by identifying yesterday’s 114.60 low as our new short-term bullish risk parameter around which both short- and longer-term traders are advised to manage the risk of an interim bullish count and position. The Fibonacci fact that yesterday’s 119.59 high was just a few ticks away from the (119.38) 76.4% retrace of May-Jul’s 133.79 – 82.54 decline on a daily log scale basis below may play a role in this decision to tighten bull risk to 114.60.


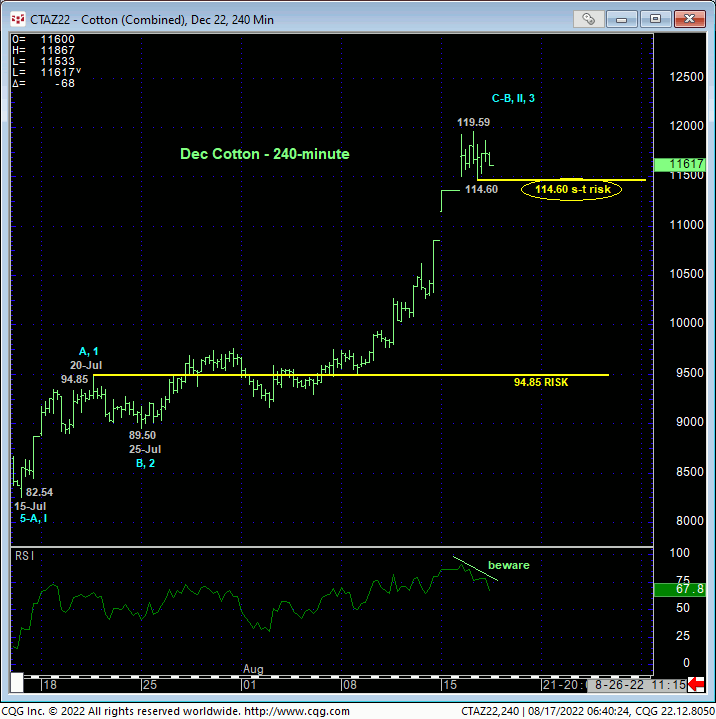
Zeroing in, both the 240-min chart above and hourly chart below show the developing potential for a bearish divergence in momentum. This indicator will be confirmed to the point of non-bullish action like long-covers on a failure below yesterday’s 114.60 low; hence this level as our new short-term bull risk level.
The prospective whipsaw problems with such a tight stop is that 1) such a mo failure will be of an insufficient scale to conclude the end of the recent rally given its scope and 2) that we cannot see an arguably complete 5-wave Elliott sequence up from 25-Jul’s 89.50 low. The only thing we’d be able to objectively glean from such a sub-114.60 momentum failure is the definition of yesterday’s 119.59 high as one of developing importance and a more reliable level from which non-bullish decisions can be objectively based and managed. But “up here”, after such a violent rebound and especially after an even steeper, more violent and 5-wave May-Jul’s decline that warns that that decline is only the START of a major peak/reversal process, it’s not hard to question the longer-term risk/reward merits of a bullish policy if/when the market confirms a bearish divergence in even short-term momentum.


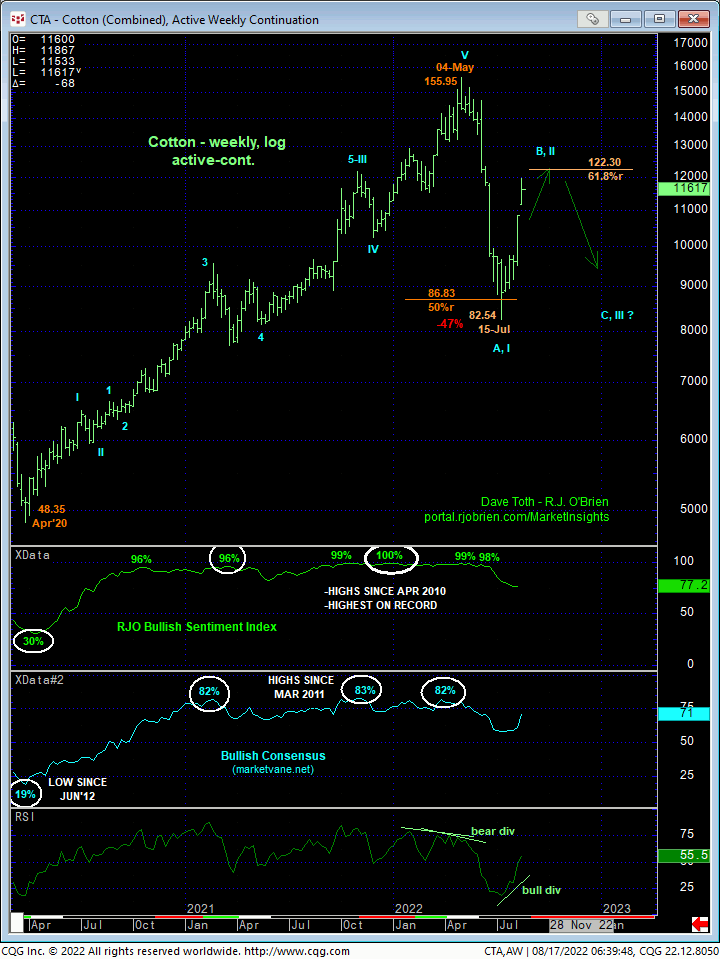
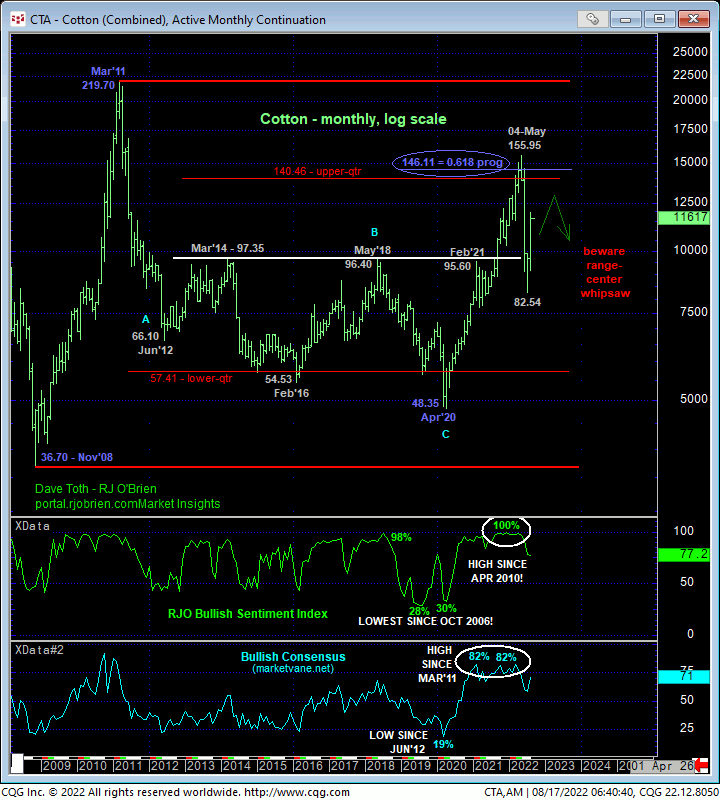
Indeed, the weekly log active-continuation chart above and monthly log chart below show the elements that warn of a major peak/reversal-threat environment that warn that the past month’s recovery is arguably a bear market correction. these elements include:
- a bearish divergence in MONTHLY momentum amidst
- what was historically frothy sentiment/contrary opinion levels
- a complete 5-wave Elliott sequence from Apr’20’s 48.35 low
- a 5-wave initial counter-trend decline from the May high to the Jul low and
- the market’s total rejection of the upper-quarter of its historical lateral range.
This confluence of technical facts and observations warns that the past month’s recovery, as impressive as it is, may only be a B- or 2nd-Wave correction within a massive peak/reversal process. To negate this count, all the bull needs to do is take out the May high(s) of 133.79 in the Dec contract and/or 155.95 on an active-continuation basis. Until and unless such trendy, impulsive strength above these levels is proven, a rally-stemming bearish divergence in momentum from any level shy of the May highs cannot be ignored as an early sign that this corrective rebound might have ended. And with C- or 3rd-Wave levels below Jul’s 82.54 low as the prospective pay-off for such a count, it’s not hard to see the risk/reward merits of managing a current bullish policy more conservatively “up here”.
These issues considered, a bullish policy and exposure remain advised with a failure below 114.60 required for shorter-term traders to take profits and move to a neutral/sideline position and for even longer-term commercial players to pare bullish exposure to more conservative levels. In lieu of such sub-114.60 weakness, further gains should not surprise.


