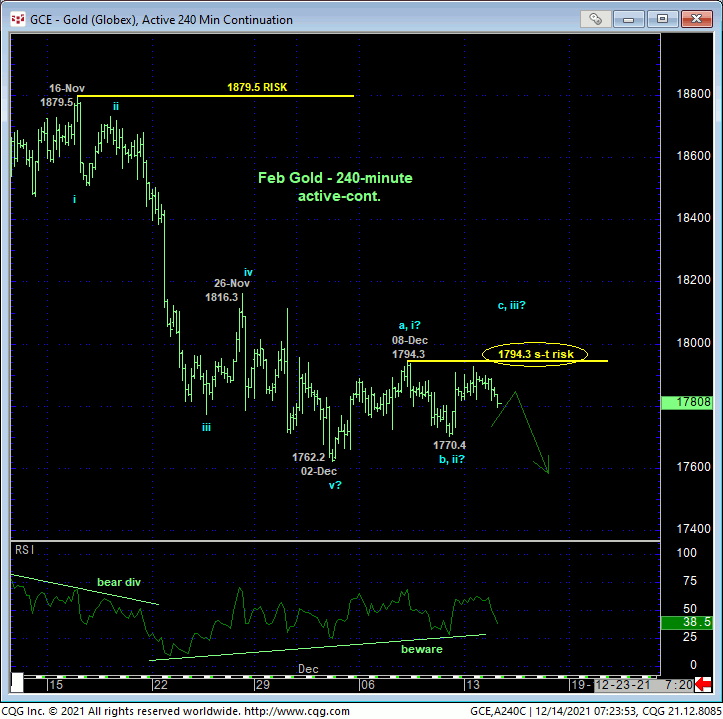

We define a confirmed bullish divergence in momentum by the market’s ability to recover above a prior corrective high or an initial counter-trend high. In the market’s intra-range drubbing over the past month, it hasn’t satisfied either of these requirements. This said, it’s easy to see waning downside momentum over the past two weeks, generating the POTENTIAL for a bullish divergence in momentum.
Following late-Nov/early-Dec’s resumption of the decline from 16-Nov’s 1879.5 high, we identified 26-Nov’s 1816.3 corrective high as our short-term risk parameter. Over the course of the past week-and-a-half’s struggling recovery attempt, we are now identifying 08-Dec’s 1794.3 high as our new short-term parameter from which shorter-term traders can objectively rebase and manage the risk of still-advised bearish exposure. For a recovery above 1794.3 will render that high an initial counter-trend high, CONFIRM the divergence and expose at least the intermediate-term trend as up. In lieu of such strength, it’s hard not to consider the past couple weeks’ labored recovery attempt as corrective/consolidative ahead of continue losses.

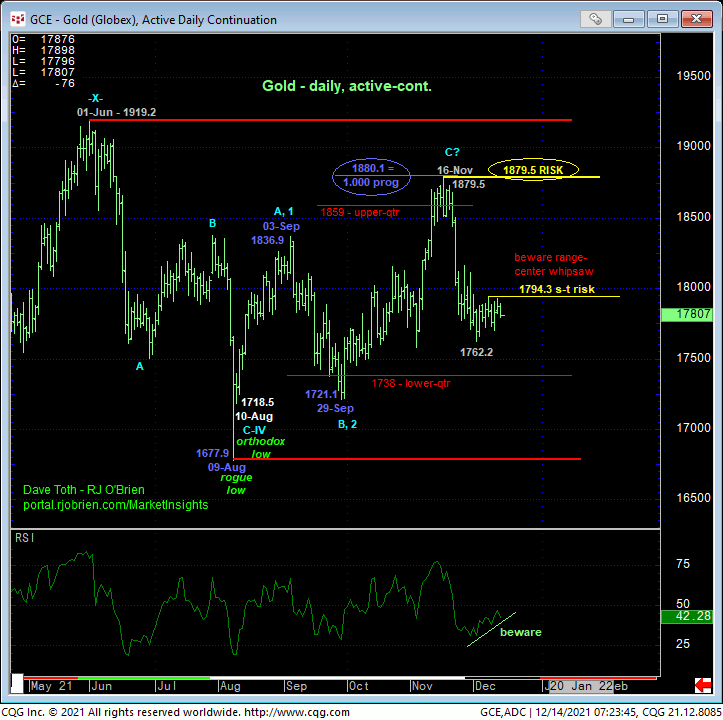
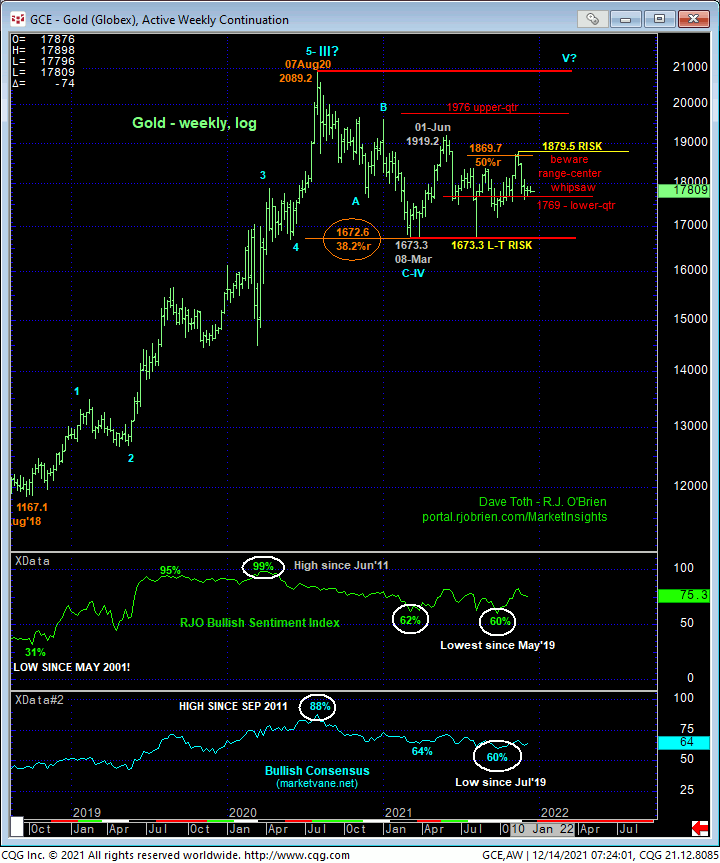
From a longer-term perspective, the daily (above) and weekly (below) charts show this market still within the throes of an incessant lateral range that dates from Aug’20’s 2089 high that is bounded on the downside by 08-Mar’s 1673 low. For the past six months, and as is typical of such middle-half bowels of broader ranges, this market has wafted aimlessly with higher odd of whipsaw risk. Against this backdrop we will be watchful for another bullish divergence in momentum from the lower recesses of this range to stem the latest intra-range slide and expose another intra-range rebound and preferred risk/reward buying opportunity. In lieu of such a momentum failure, even an admittedly smaller-degree divergence above 1794.3, further lateral-to-lower prices should not surprise.

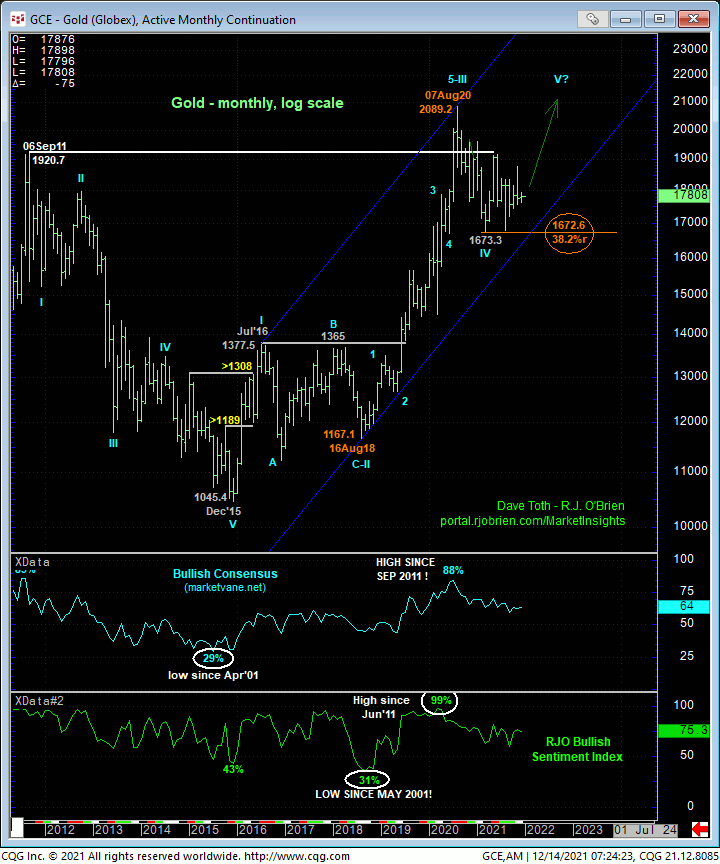
As frustrating and challenging as the 16-month lateral chop is, long-term players are reminded that on a monthly log scale basis below, this bloody mess remains arguably a massive (4th-Wave) correction on the heels of Aug’18-to-Aug’20’s massive 3rd-Wave rally from 1167 to 2089. And the Fibonacci fact that this sell-off attempt has thus far only retraced a Fibonacci minimum 38.2% of that suspected 3rd-Wave arguably underscores the long-term strength of this market. But herein also lies the pivotal importance of Mar’s 1673.3 low and key long-term bull risk parameter, the break below which will expose the possibility of a major reversal lower.
These issues considered, a bearish policy and exposure remain advised with a recovery above 1794.3 deferring or threatening this call enough to warrant moving to a neutral/sideline position to circumvent the heights unknown of another intra-range recovery or possibly a resumption of the secular bull market. In lieu of such strength, further lateral-to-lower price action remains anticipated.


