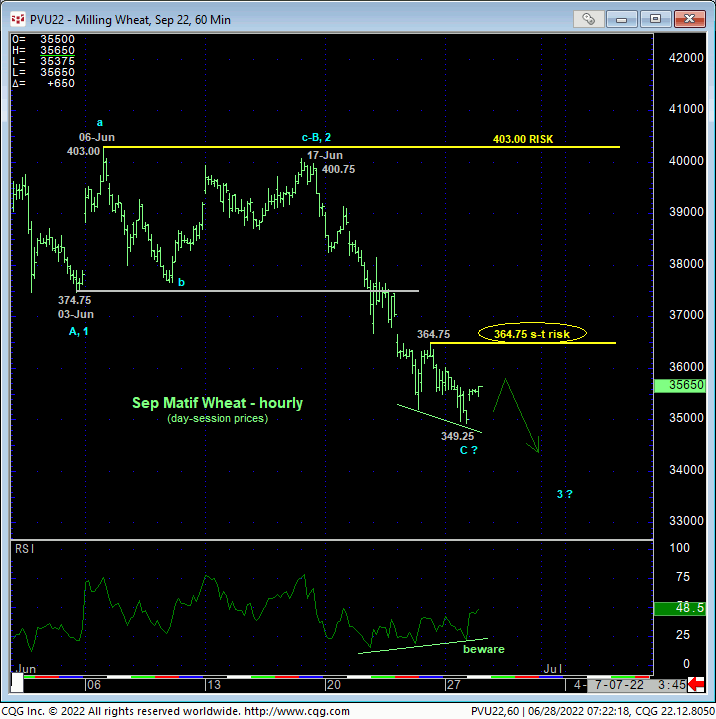
As a result of yesterday’s continued slide and break of last week’s 352.00 low, the hourly chart below shows that this market has identified Fri’s 364.75 high as the latest smaller-degree corrective high this market now needs to sustain losses below to maintain a more immediate bearish count. Its failure to do so will confirm a bullish divergence in short-term momentum and break at least the portion of the developing bear trend from 06-Jun’s 403.00 larger-degree corrective high, exposing at least a correction of this portion of the 6-week peak/correction/reversal environment from 17-May’s 444.50 high. Per such, this 364.75 level serves as our new short-term risk parameter from which shorter-term traders with tighter risk profiles can objectively rebase and manage the risk of a still-advised bearish policy and exposure.


From a longer-term perspective and while we’ve advocated a bearish policy and exposure because it is, in fact, consistent with the developing downtrend, we still have to acknowledge the ultimately bullish prospect that the 6-week sell-off attempt from 17-May’s 444.50 high is just a larger-degree correction. Indeed and relative to the magnitude of the secular bull trend, this thus-far-3-wave decline from that 444.50 high still falls well within the bounds of a mere correction. IF this is the case however, then somewhere and sometime SOON this market needs to arrest the clear and present and developing downtrend with a bullish divergence in, initially, short-term momentum above a level like 364.75.
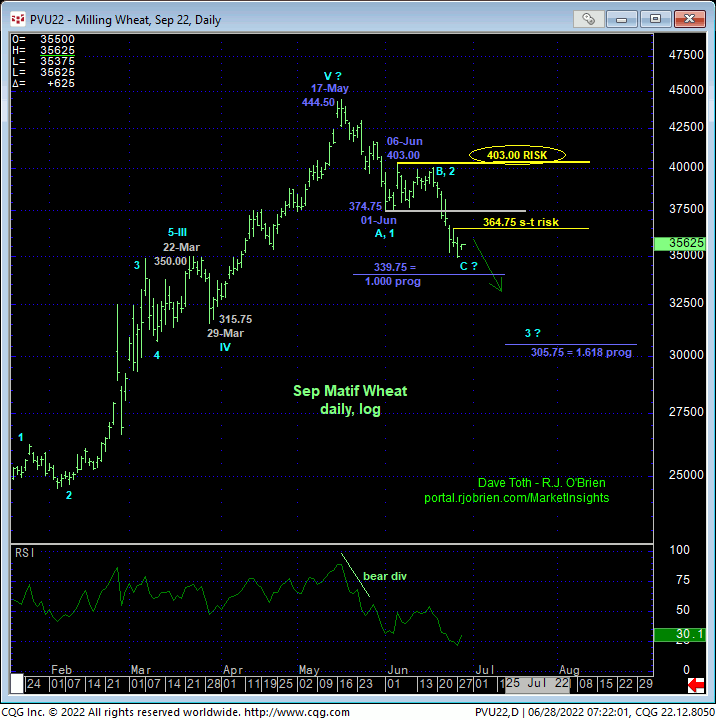
But even such a short-term mo failure above 364.75 would still leave this market BELOW former 374.75-area support-turned-resistance and especially below 06-Jun’s 403.00 larger-degree corrective high this market needs to recoup to CONFIRM the decline from 444.50 as a 3-wave and thus corrective structure that would then re-expose the secular bull. Until and unless such commensurately larger-degree strength is proven, there is no way to know that the resumed decline from 403.00 isn’t the dramatic 3rd-Wave of an eventual 5-wave sequence down of a major peak/reversal process.
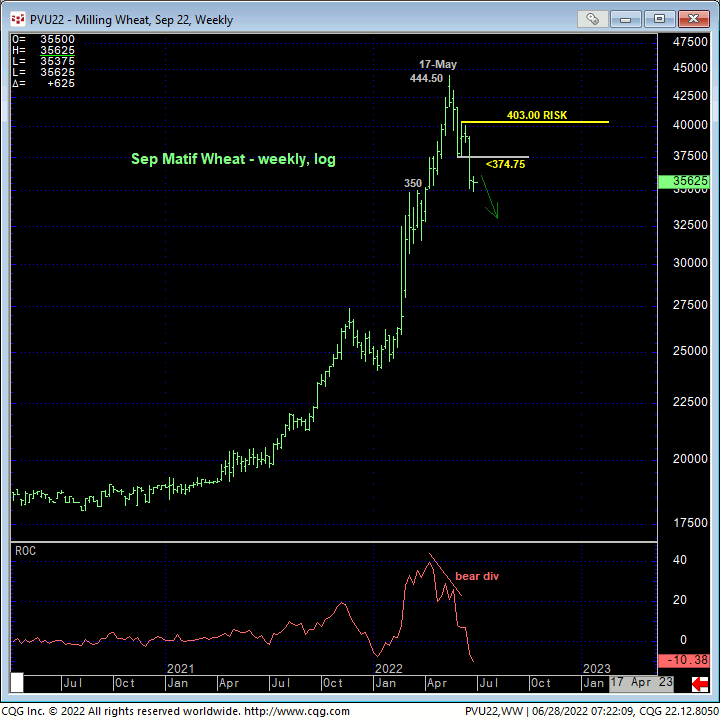
IF this market IS in such a 3rd-Wave down, we would expect the market to BEHAVE LIKE A BEAR by sustaining trendy, impulsive and increasingly obvious behavior to the downside, like sharp losses to the 305-handle-area that would make this suspected 3rd-Wave decline from 403.00 61.8% longer (i.e. 1.618 progression) than May’s suspected 444.50 – 374.75 1st-Wave. And we would remind longer-term players that this market is coming off a bearish divergence in WEEKLY momentum shown below, so the prospect of a major peak/reversal is a very realistic one until mitigated by a recovery above at least the 375-area support-turned-resistance and especially 403.00.
These issues considered, a bearish policy and exposure remain advised with a recovery above 364.75 required for shorter-term traders to move to the sidelines and subsequent strength above the 375.00-area and ultimately 403.00 for longer-term commercial players to pare and then neutralize bearish exposure. IN lieu of such strength, further and possibly accelerated losses remain anticipated.


