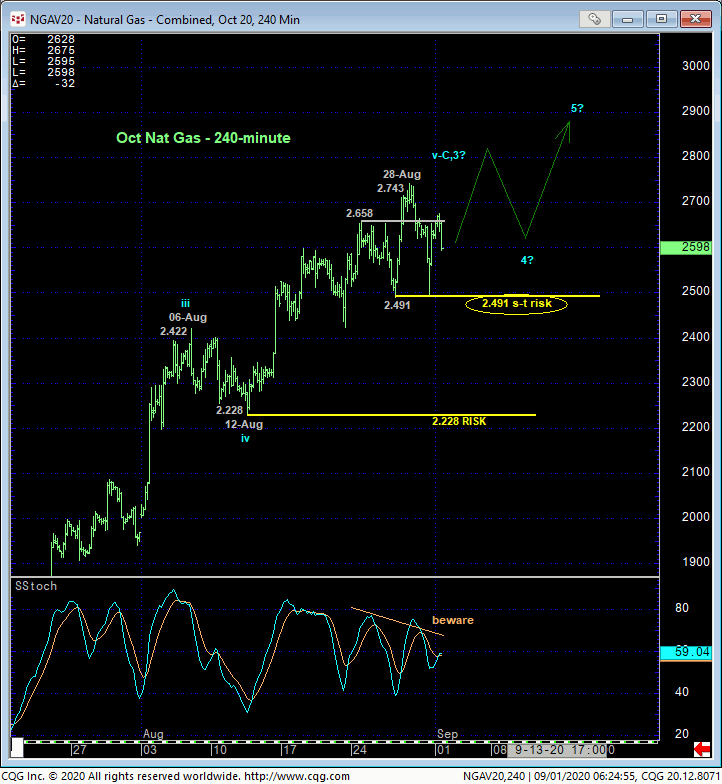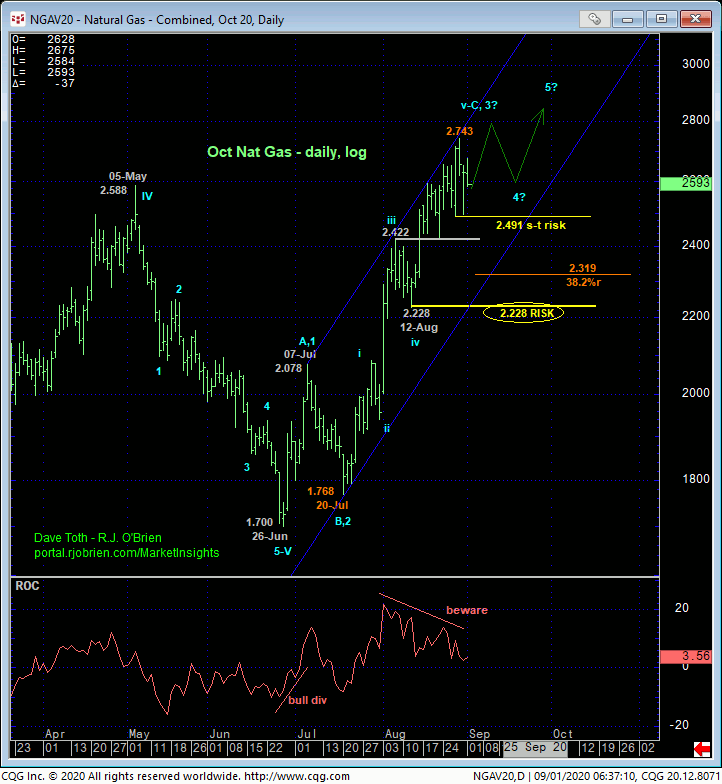

The 240-min chart above shows Thur/Fri’s continued rally leaving Thur’s 2.491 low in its wake as the latest smaller-degree corrective low the market would be expected to sustain gains above to maintain a more immediate bullish count. Its failure to do so will confirm a bearish divergence in short-term momentum and at least interrupt the bull in favor of an interim correction. But with the potential for a bearish divergence developing on a DAILY basis below and with the prospect that the market may be nearing the end of a 5-wave Elliott sequence up from 20-Jul’s 1.768 low, we cannot ignore the prospect of an admittedly short-term mo failure below 2.491 morphing into a more protracted correction where even the Fibonacci minimum 38.2% retrace of a suspected 3rd-Wave rally from 1.768 to 2.743 doesn’t cut across until the 2.319-area. Commensurately larger-degree weakness below 12-Aug’s 2.28 next larger-degree corrective low is required however to confirm a momentum failure on this daily scale.

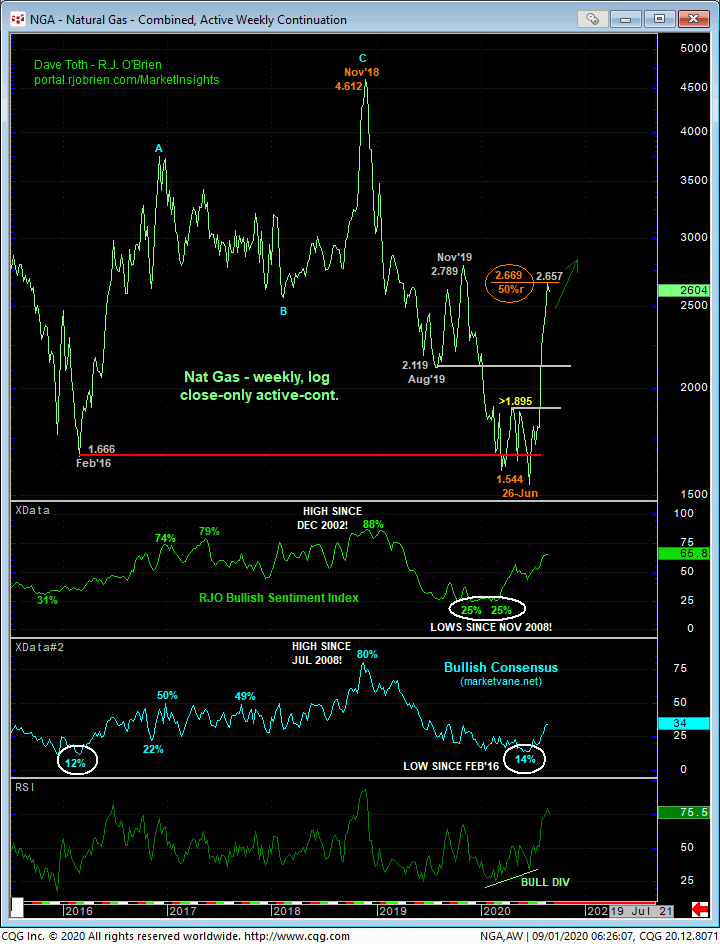
Interestingly and possibly a contributing factor to at least an interim corrective setback is the Fibonacci fact that Jun-Jul’s recovery has thus far retraces exactly 50% of Nov’18 – Jun’20’s 4.612 – 1.544 decline on a weekly log close-only basis below. Long-time readers of our research know of our disdain for merely “derived” technical levels like trend lines, Bollinger Bands, imokus, the ever-useless moving averages and even the vaunted Fibonacci relationships we cite often in our analysis without an accompanying confirmed bearish (in this case) divergence in momentum. Such derived levels NEVER have proven to be reliable reasons to conclude resistance (or support) on their own, and they never will. BUT IF the market breaks the clear and present uptrend with a mo failure below at least 2.491 needed to reject/define a more reliable high and resistance from which non-bullish decisions can only then be objectively based and managed, then the COMBINATION of that mo failure with this Fib retrace can be a powerful one.

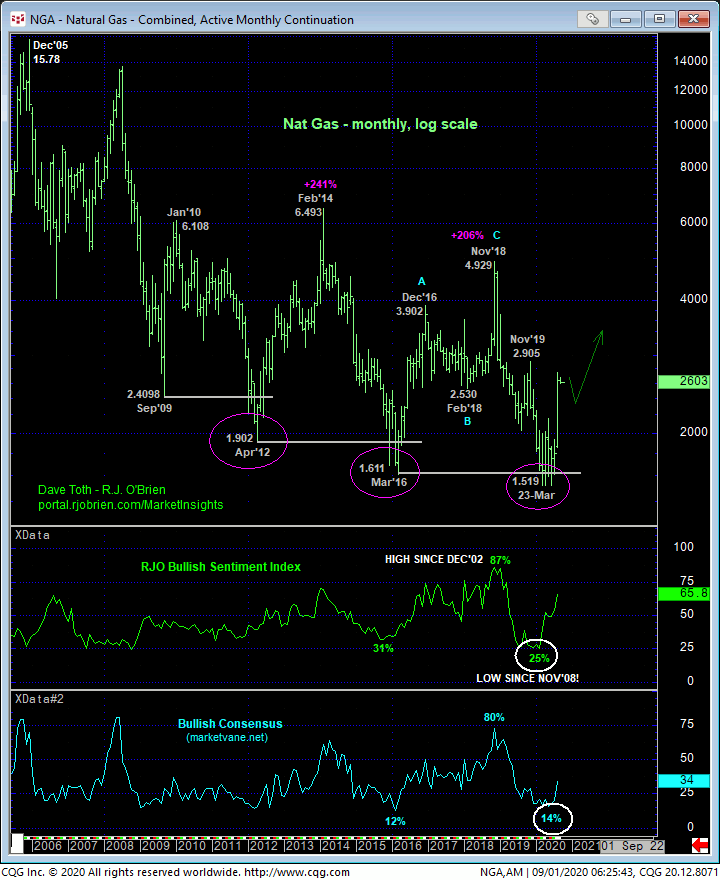
Finally, from an even longer-term monthly log scale perspective below, we maintain a long-term base/reversal count from 23-Mar’s 1.519 low that we believe could be massive in scope, spanning quarters and possibly years with upside potential to 4.00+. Such a base/reversal prospect is, quite simply, based on the exact same momentum, sentiment and failure to sustain new multi-year lows that warned of and accompanied both 2012-14’s 241% reversal and 2016-18’s 206% reversal.
We fully anticipate corrective rebuttals lower throughout a base/reversal PROCESS that could span quarters and provide the TIME required for the bullish fundamentals to eventually filter in and be recognized more fully by the world’s collective assessment. Fundamental rationale for a major reversal is rarely obvious to the huddled masses early in the reversal process. This is solely the domain of technical analysis that acknowledges the typical (B- or 2nd-Wave) corrective relapse within the broader base/reversal process.
These issues considered, a bullish policy and exposure remain advised with a failure below 2.491 needed to confirm a bearish divergence in short-term mo sufficient for shorter-term traders to move to a neutral/sideline position and for longer-term players to pare bullish exposure to more conservative levels. In lieu of such sub-2.491 weakness, the trend remains arguably up and should not surprise by its continuance or acceleration.


