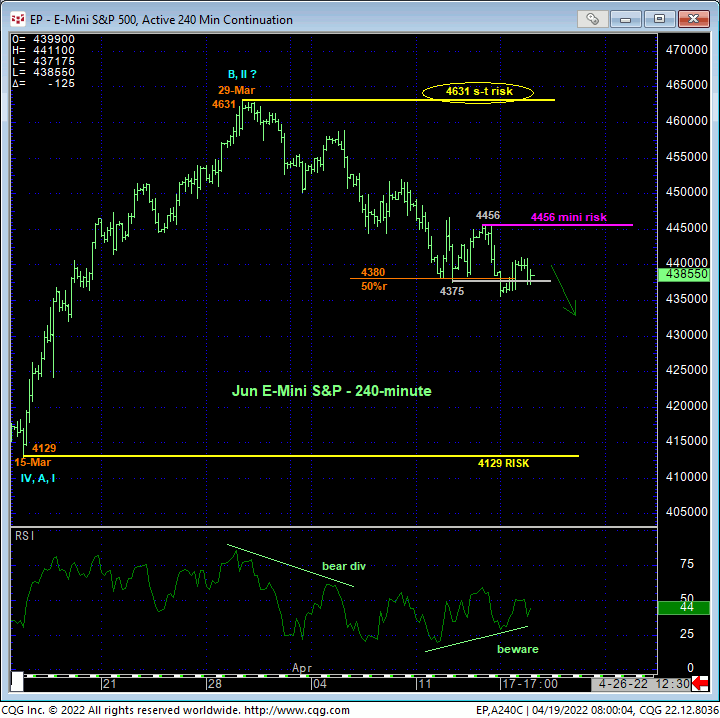
Yesterday’s continued slide below last week’s 4375 low reaffirms and reinstates the intermediate-term downtrend exposed by 06-Apr’s bearish divergence in momentum discussed in that day’s Technical Blog. This continued slide leaves Thur’s 4456 high in its wake as the latest smaller-degree corrective high this market is now minimally required to recoup to arrest the 3-week decline and expose another intra-range pop or perhaps a more protracted resumption of Mar’s impressive recovery. Per such, this 4456 level is considered a tight but effective risk parameter from which bearish policy and exposure can be objectively rebased and managed, especially from the middle-half bowels of this year’s lateral range where the odds of aimless whipsaw risk are approached as higher, warranting a more conservative approach to risk assumption.

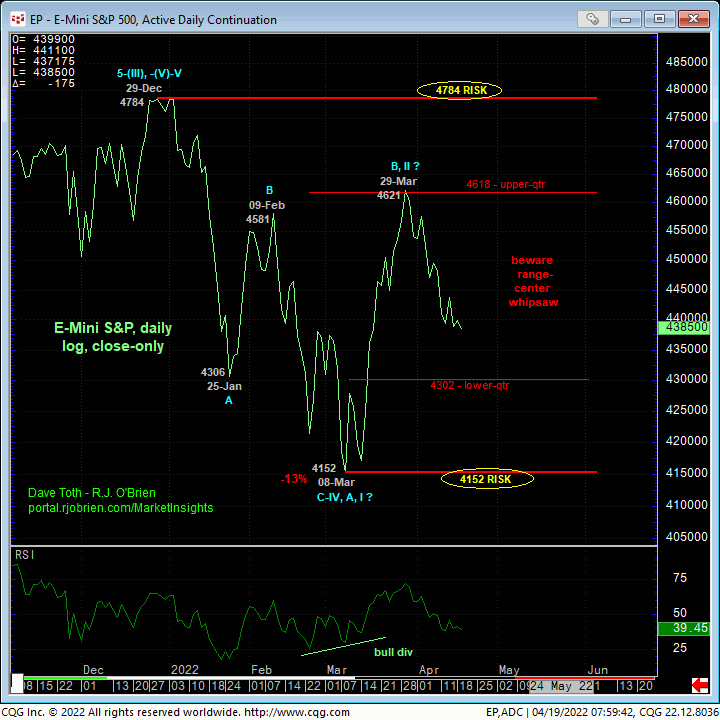
The current major technical and trading challenge is this market’s position deep within the middle-half bowels of this year’s range shown in the daily log close-only chart above. Such range-center environments are notorious for aimless whipsaw risk where the risk/reward merits of initiating directional exposure are abhorrent, warranting a more conservative approach to risk assumption. Such an approach requires much tighter but objective risk parameters exactly like Thur’s 4456 minor corrective high.
If we’re supposed to be cautiously bearish- and we are since at least the intermediate-term trend is down within a still-arguable major peak/reversal threat- then the market should be expected to BEHAVE LIKE A BEAR by sustaining trendy, impulsive price action lower. A recovery above 4456 won’t necessarily negate a broader bearish count. But from the middle of this year’s range it would defer or threaten the count enough to warrant neutralizing exposure and exchanging whipsaw risk for steeper nominal risk above 29-Mar’s 4631 high.

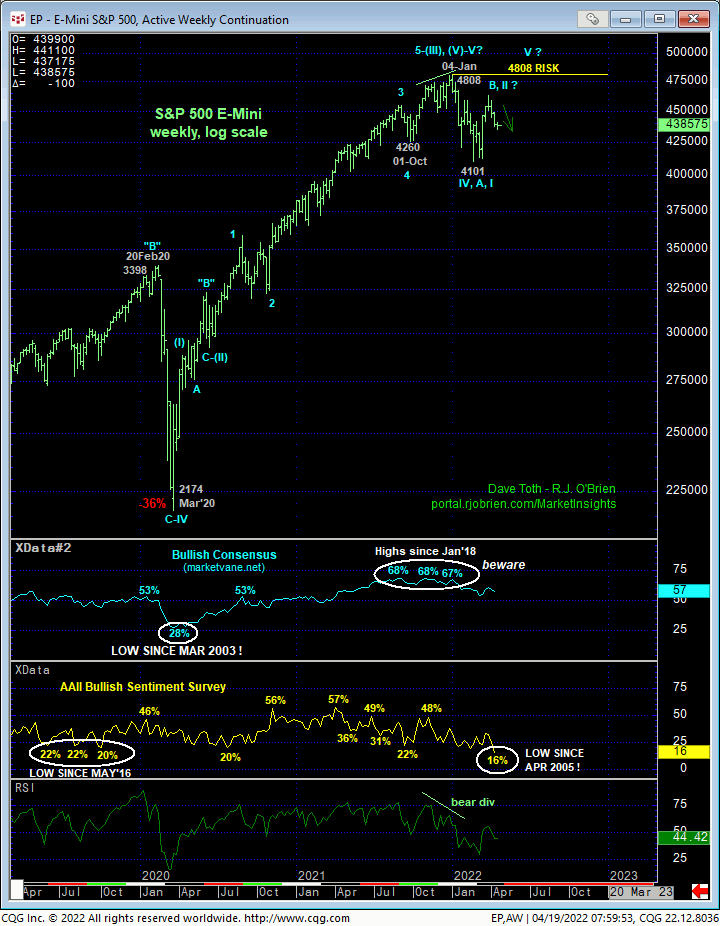
From a much longer-term perspective shown in the weekly log chart below, the major peak/correction/reversal elements introduced back in mid-Jan remain intact:
- a confirmed bearish divergence in MONTHLY momentum that breaks the major bull trend from at least Mar’20s 2174 low amidst
- historically frothy sentiment and portfolio equity allocations and
- a complete 5-wave Elliott sequence from the Mar’20 low.
Until negated by a recovery above 04-Jan’s 4808 high and long-term bear risk parameter, the prospect for lateral-to-lower, and possibly much lower prices remains intact.
However, one of the key sentiment/contrary opinion indicators we monitor closely is the American Association of Individual Investors (AAII) Sentiment Survey. And despite the market’s past few weeks’ relatively benign erosion within the middle of this year’s range, the weekly chart below shows this indicator eroding to a 17-YEAR low of 16%. This indicator and such current pessimism would NOT be a reason to consider the market vulnerable to a RALLY if the market was in the midst of a major downtrend. But this market is not in such a clear and present downtrend. It’s wafting around in the middle of a 3-1/2-month range. And for the huddled masses to be this worried about falling prices when the market is merely trading sideways is a warning that the market might be becoming vulnerable to a move HIGHER, not lower. And an admittedly short-term bullish divergence in momentum above 4456 would be viewed as a short-term catalyst to such a move higher. UNTIL at least 4456+ strength is proven however, further and possibly accelerated losses remain anticipated.
In sum, a cautious bearish policy and exposure remain advised with a recovery above 4456 threatening this call enough to warrant moving to a neutral/sideline position in order to circumvent the heights unknown of another intra-range pop or possibly a resumption of the secular bull trend. In lieu of such strength, further and possibly accelerated losses should not surprise.
And a final thought: There’s a reason why some of the most successful traders in the world are right on only about a third of their directional decisions. It’s because markets spend about two-thirds of their time in non-trending environments (either consolidation or reversal processes) that are much more difficult to navigate and trade. That’s why the old adage “The trend is your friend” remains as applicable as it ever has. Since mid-Jan, this market has broken the previous major bull trend. This is a technical fact. It is now either consolidating within the still-unfolding secular bull or reversing it. Traders and investors must acknowledge this condition and be aware of and prepared for its challenges.


