Posted on Feb 16, 2023, 09:40 by Dave Toth
MAR 10-Yr T-NOTES
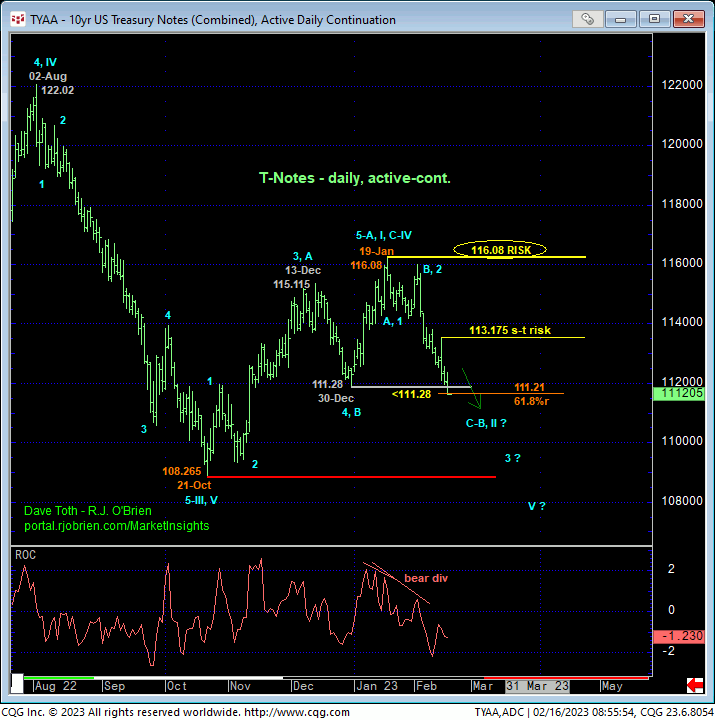
Today’s continued relapse reinforces our peak/correction/relapse count introduced in 06-Feb’s Technical Blog and leaves Tue’s 113.175 high in its wake as the latest smaller-degree corrective high this market is now minimally required to recover above to arrest the past month’s broader decline and perhaps resurrect a longer-term base/reversal count. Until and unless at least such 113.175+ strength is shown, and especially given today’s confirmation of a bearish divergence in WEEKLY momentum, further losses are anticipated, including the resurrected prospect of a resumption of the secular bear market in Treasuries and rise in 10-yr rates. Per such, we’re identifying 113.175 as our new short-term bear risk parameter.


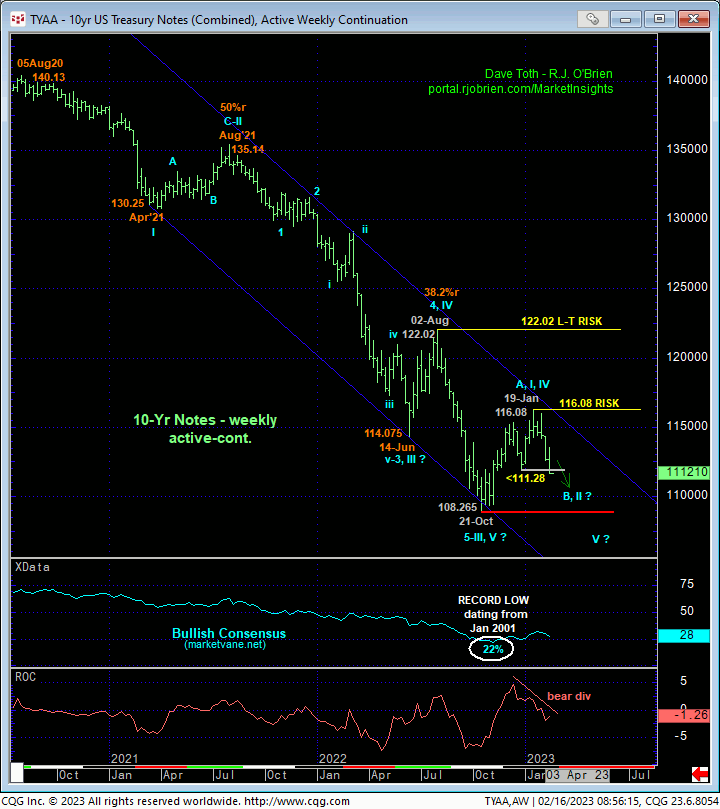
On a broader scale, it remains indeterminable whether Oct-Jan’s recovery from 108.265 to 19-Jans 116.08 high is a 3- or 5-wave affair. As such and especially given the backdrop of a secular bear trend from Aug’20 and as has occurred in the Mar24 SOFR contract, we cannot ignore the possibility that Oct-Jan’s recovery attempt is just a 3-wave correction ahead of a resumption of the secular bear market in T-Note prices and rise in 10-yr rates. But what we DO know is that today’s failure below 30-Dec’s 111.28 larger-degree corrective low, in fact, breaks Oct-Jan’s uptrend and confirms 19-Jan’s 116.08 high as THE high this market now must recoup to resurrect a major base/reversal count. Per such, this 116.08 becomes our new and obviously key long-term bear risk parameter.
IF Oct-Jan’s rally is the start of a major base/reversal count, then by definition this market must arrest the past month’s downtrend with a countering bullish divergence in momentum somewhere between spot and 21Oct22’s 108.265 low. Perhaps this divergence will occur around the immediate area of the (111.21) 61.8% retrace of Oct-Jan’s rally. And herein lies the importance of even a shorter-term bear risk parameter at 113.175. IF the secular bear trend is resuming, we would expect the bear to BEHAVE LIKE ONE by sustaining trendy, impulsive behavior lower and NOT be able to recover above 113.175.
It may also prove notable that today’s relapse below 111.28 confirms a bearish divergence in WEEKLY momentum shown below. Still above Oct’s 108.265 low, we cannot conclude a resumption of the secular bear market at this juncture. But until and unless this market recovers above at least 113.175, traders must acknowledge the resurrected prospect of a resumption of the 30-MONTH bear market in T-Note prices and rise in 10-yr rates.
These issues considered, a bearish policy remains advised with a recovery above 113.175 required for both short- and longer-term traders to move to a neutral/sideline position. In lieu of such strength, further and possibly accelerated losses should not surprise. We will, of course, keep a keen eye on MOMENTUM “down here” where a countering bullish divergence could change the directional landscape quickly and opportunistically.

MAR E-MINI S&P 500
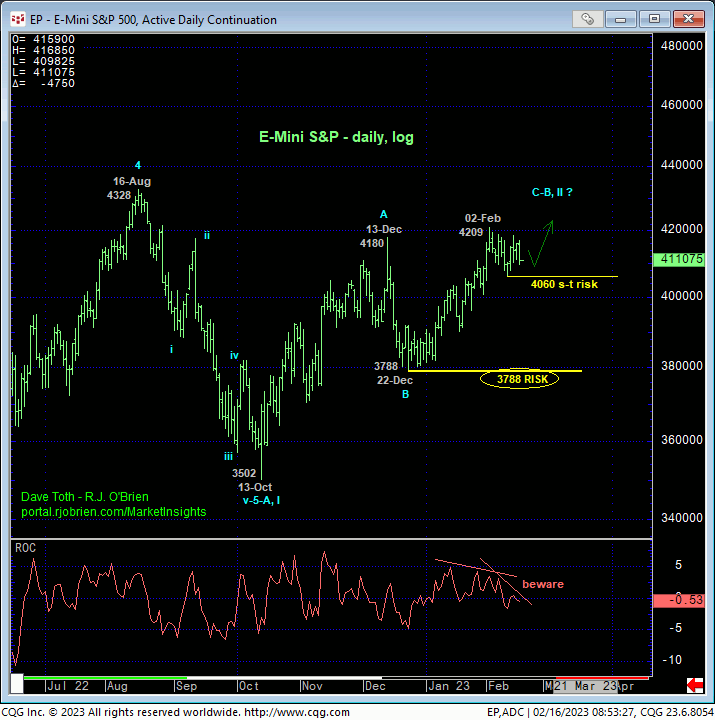
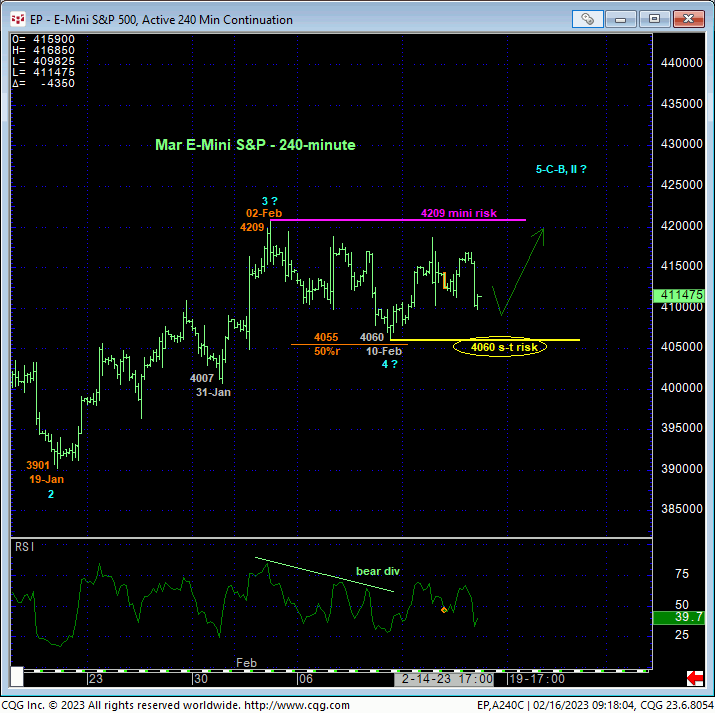
In light of the recent jump in rates across the entire yield curve due to higher CPI and PPI reports this week, we’re tightening our short-term bull risk parameter from 31-Jan’s 4007 low to 10-Feb’s 4060 low detailed in the 240-min chart below. A failure below 4060 would render that low an initial counter-trend low and confirm a bearish divergence in daily momentum, threatening the rally from at least 22-Dec’s 3788 low.
The 240-min chart already shows a bearish divergence in short-term momentum last Fri, defining 02-Feb’s 4209 high as one of developing importance and a mini risk parameter from which non-bullish decisions like long-covers can be objectively based and managed. But this mo failure is of too small a degree or scale to break Dec-Feb’s uptrend. Commensurately larger-degree weakness below 4060 is required to accomplish such a larger-degree momentum failure that would, in fact, break the 2-1/2-month uptrend.


The daily log scale chart above shows the developing POTENTIAL for a bearish divergence in momentum that will be considered CONFIRMED to the point of non-bullish action like long-covers on a failure below 4060, threatening Dec-Feb’s uptrend. And while even steeper weakness below 22-Dec’s 3788 larger-degree corrective low and key long-term bull risk parameter remains required to break the uptrend from last Oct’s 3502 low and re-expose the secular bear market, the weekly log close-only chart below shows the market having retraced 50% of last year’s entire 4762 – 3596 decline while market sentiment/contrary opinion levels have, understandably, rebounded significantly.
Indeed, the AAII Sentiment Survey is at its highest level since Dec’21’s major top. This return to at least benign sentiment levels does not mean this market cannot rally significantly further. However, up significantly from historically bearish levels removes it as a non-bearish element.

Lastly, and while we won’t reiterate all of the elements that warned of last year’s major peak/reversal and new bear market that remains quite in play, relative to recent moves in the interest rate complex, we remind traders and investors of the gravity of the inverted yield curve, especially the differential between 3-mo T-Bills and 10-Yr T-Notes. With 3-mo T-Bills yielding over 90-bps OVER 10-yr T-Notes, this differential remains at inverted levels seen only three other times since 2000, and each of these three previous occurrences resulted in at least 2018-to-2020’s major and volatile correction and in the 2007-to-2009 and 2000-to-2002 major bear markets. With the market still 16% below last year’s all-time high, the recovery from last Oct’s low remains well within the bounds of a major bear market correction.
These issues considered, a bullish policy and exposure remain advised with a failure below 4060 required for shorter-term traders to move to a neutral/sideline position and for longer-term institutional players to pare exposure to more conservative levels. A recovery above 4209 is obviously required to reinstate and reaffirm the bull trend that, if accomplished, we believe could produce gains to the 4300-handle-area into late-Mar.


