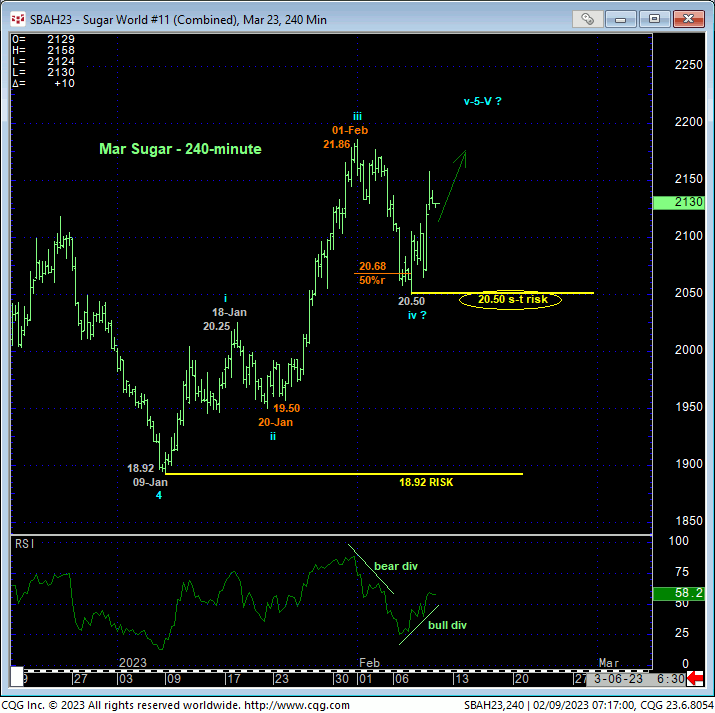
Yesterday mid-day’s recovery above a minor initial counter-trend high at 21.05 from Tue confirms a bullish divergence in short-term momentum as detailed in the 240-min chart below. On the heels of a suspected 3rd-Wave rally from 20-Jan’s 19.50 low to 01-Feb’s 21.86 high, we believe this defines Tue’s 20.50 low as the end or lower boundary to a 4th-Wave correction ahead of a suspected 5th-Wave rally and resumption of the secular bull trend to at least one more high above 21.86.
A relapse below 20.50 will render that low an initial counter-trend low and, as we’ll show below, confirm a bearish divergence in daily momentum that could contribute to a peak/reversal count that could be major in scope. Per such and despite its shorter-term nature, we’re defining 20.50 as our new short-term but key risk parameter from which a continued bullish policy and exposure can be objectively rebased and managed by both short- and longer-term traders alike.


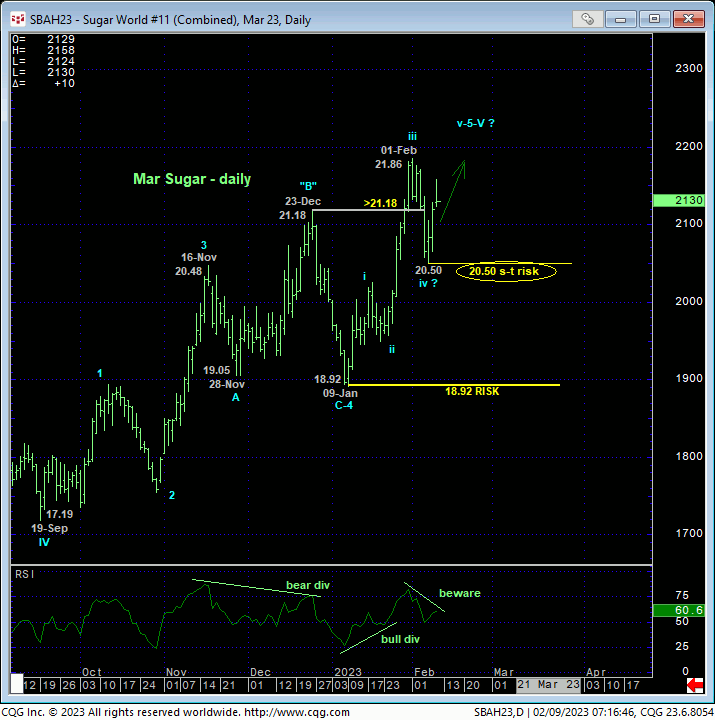
The daily chart above shows the nicely developing POTENTIAL for a bearish divergence in momentum that will be considered CONFIRMED to the point on non-bullish action like long-covers and new bearish exposure on a failure below 20.50. Until and unless such sub-20.50 weakness is proven, the market has yet to satisfy even the first (a bearish divergence in daily momentum) of our three key reversal requirements, so a (suspected 5th-Wave) resumption of the bull is expected.
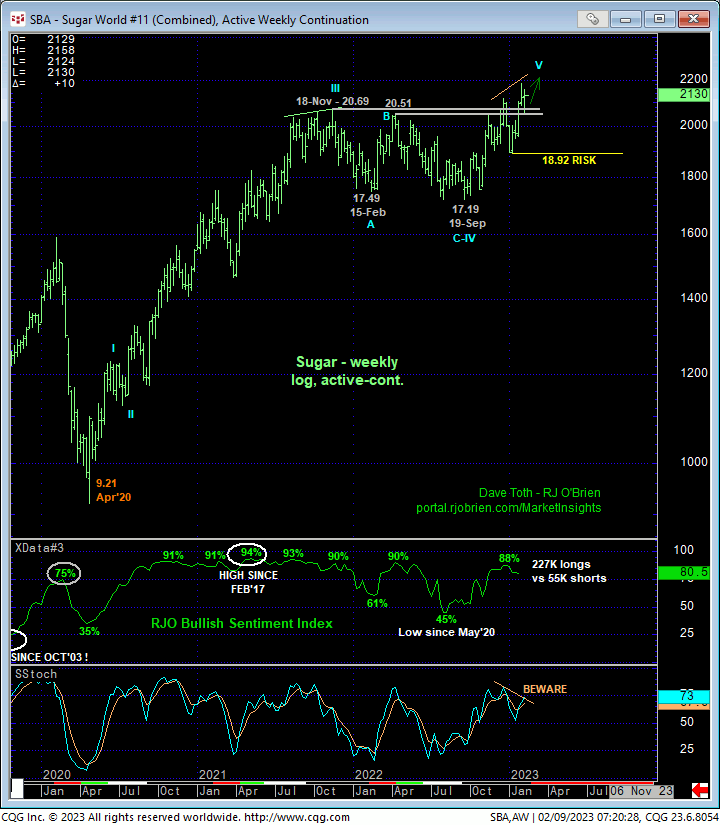
On a longer-term scale, the weekly log active continuation chart below shows the market thus far sustaining gains above hugely important former resistance around the mid-20-handle-area that, since broken, serves as a new key support candidate. If/when this market is warning of a top that may be major in scope, it needs to prove preliminary “non-strength” below the 20.50-area and then subsequent confirm commensurately larger-degree weakness below 09-Jan’s 18.92 larger-degree corrective low and key long-term bull risk parameter.
The weekly chart below also shows waning upside momentum amidst understandably historically bullish sentiment/contrary opinion levels typical of major peak/reversal environments. But these elements mean nothing until and unless the market even threatens, let alone breaks the clear and present and major but simple uptrend pattern of higher highs and higher lows. MINIMALLY, this requires a failure below 20.50. Until and unless such weakness is shown, a continuation of the major bull trend to new highs above 21.86 is anticipated. And once above 21.86, there are NO levels of any technical merit shy of 2016’s 24.10 high, so the market’s upside potential above 21.86 is indeterminable and potentially extreme.
These issues considered, a bullish policy and exposure remain advised with a failure below 20.50 required to defer or threaten this call enough to warrant a move to the sidelines by both short- and longer-term players.


