Posted on Jun 06, 2023, 11:56 by Dave Toth
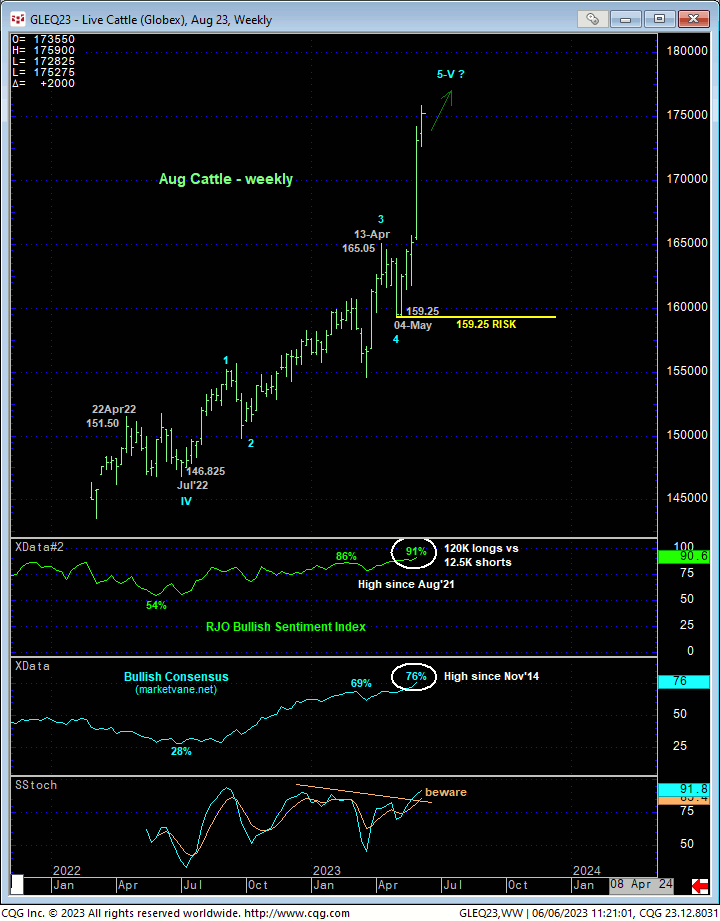
The explosive continuation of the secular bull trend over the past week to new all-time high is clear in the weekly chart of the Apr contract below. The trend is up on every conceivable scale and should not surprise by its continuance or further acceleration straight away. That’s the easy part.
The challenging part now, waaaaaay “up here”, is managing the risk of a continued bullish policy and exposure.
This weekly chart also shows understandably historically extreme bullish sentiment/contrary opinion levels not seen it at least two years and, in the case of the Bullish Consensus (marketvane.net), since Nov 2014’s massive peak and subsequent collapse. There should be no doubt of an eventual, inevitable repeat of 2014’s massive top. But until and unless this market satisfies even the first of our three key reversal requirements, the market’s upside potential remains as indeterminable and potentially extreme as it has since mid-May when it rendered mid-Apr-to-early-May’s setback attempt a 3-wave and thus corrective structure that re-exposed the secular bull.
To, in fact, break the secular bull trend, commensurately larger-degree weakness below 04-May’s 159.25 larger-degree corrective low remains required. In this vein, this 159.25 low remains intact as our key long-term bull risk parameter.


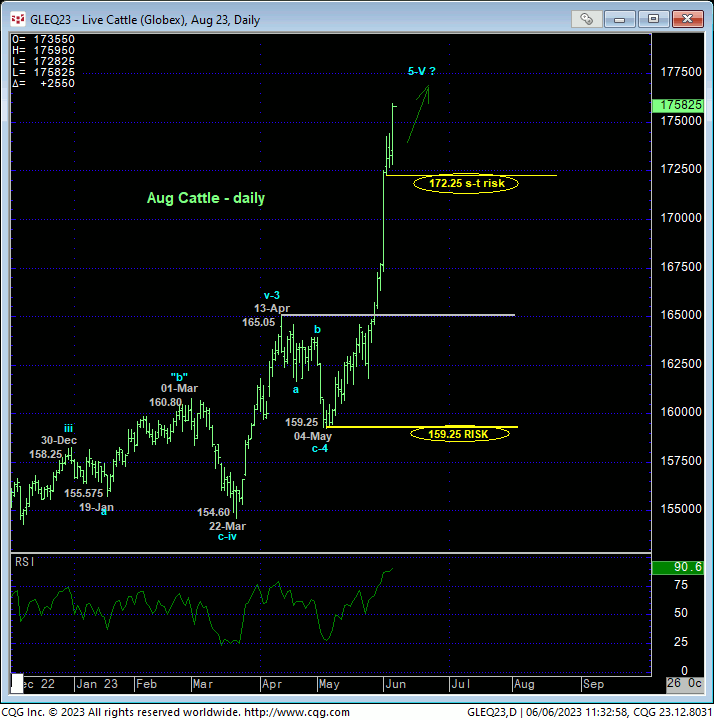
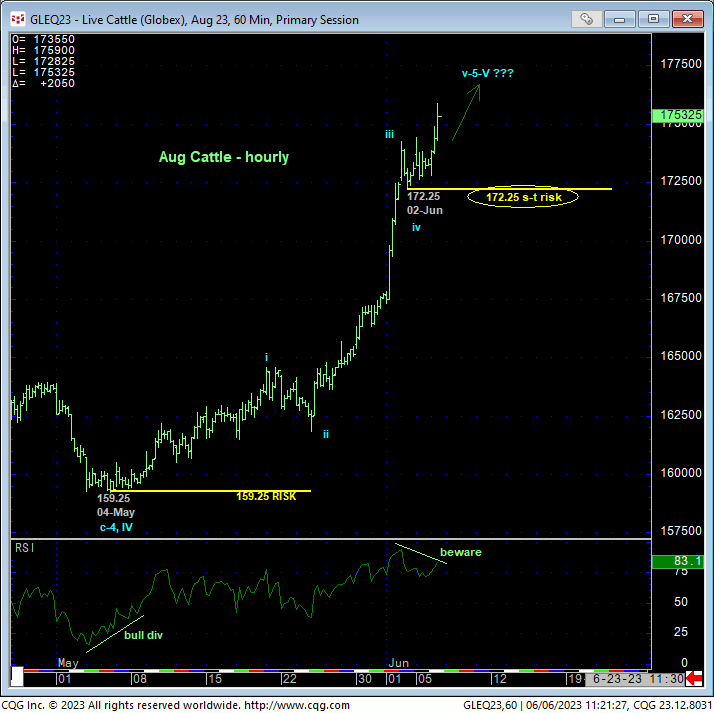
The daily chart above shows the clarity of the clear and present and major bull trend stemming from the extent and uninterrupted nature of the past week’s explosive rally. The hourly chart below shows that by virtue of today’s break above Fri’s 174.25 high, the market has identified Fri’s 172.25 low as the latest smaller-degree corrective low the market needs to sustain gains above to maintain a more immediate bullish count. Its failure to do so will confirm a bearish divergence in momentum and break what would then appear to be a complete 5-wave Elliott sequence up from 4-May’s 159.25 larger-degree corrective low and break this portion of the secular bull. Per sch, we’re defining this 172.25 low as our new short-term but key parameter from which at least shorter-term traders and even longer-term commercial players can objectively rebase and manage the risk of a still-advised bullish policy and exposure.
What’s crucial to acknowledge as a result of today’s resumed bull trend is that there are NO levels of any technical merit below 172.25 shy of at least former 165.00-area resistance-turned-support from mid-Apr. NONE. If bull risk is not managed on a failure below 172.25, one is acknowledging and accepting either 1) bull risk to at least the 165.00-area or 2) picking any subjective, emotional level out of thin air between 172.25 and the 165.00-area (which is obviously outside the bounds of technical discipline). Even for long-term commercial players, such risk to 165 is too extreme and impractical.
Rather, longer-term players are urged to at least pare, if not neutralize bullish exposure on a failure below 172.25 in order to circumvent the totally unknown depths of a larger-degree correction or possible major reversal lower. This defensive measure acknowledges and accept whipsaw risk, back above whatever high is left in the wake of such a sub-172.25 failure, in exchange for much steeper nominal risk below 165. If/when the market fails below 172.25, and if that setback is just another piddly correction within the secular bull, a relapse-countering bullish divergence in short-term mo will arrest that setback and reject/define a more reliable low and support from which the risk of a resumed bullish policy can then be objectively and more effectively rebased and managed. If no defensive measure is taken on a failure below 172.25, remaining bulls have only “hope” for the bull to resume. And hope is not an objective investment strategy or technical tool.
It is full acknowledged that a piddly mo failure below 172.25 is grossly insufficient to conclude anything more than another corrective burp within the bullish stampede. But below 172.25, even a relatively small correction could be nominally steep under the current rampaging circumstances.

Finally, the monthly log chart below shows this month’s break above Nov 2014’s previous all-time high of 172.75. There is NO RESISTANCE up here. The ONLY levels of any technical merit currently exist only below the market in the forms of former resistance-turned-support like the 165-area and prior corrective lows like 172.25 and 159.25. To say we know how much further this bull has to run is to say we know how long a length of string is.
These issues considered, a bullish policy and exposure remain advised with a failure below 172.25 required for both short- and long-term traders to move to a neutral/sideline position to circumvent the depths unknown of probably a larger-degree correction and possibly a major reversal lower. But even on a failure below 172.25, the forces that have driven this beast this long aren’t going to evaporate overnight. There will most likely be a significant amount of peaking behavior that will include an initial counter-trend break and then subsequent corrective rebuttal attempts before the threat of a reversal may be more objectively considered.


