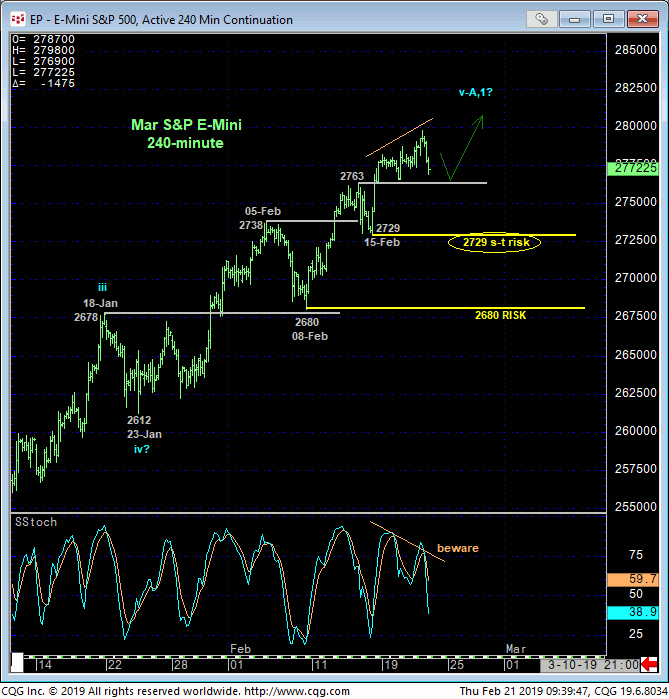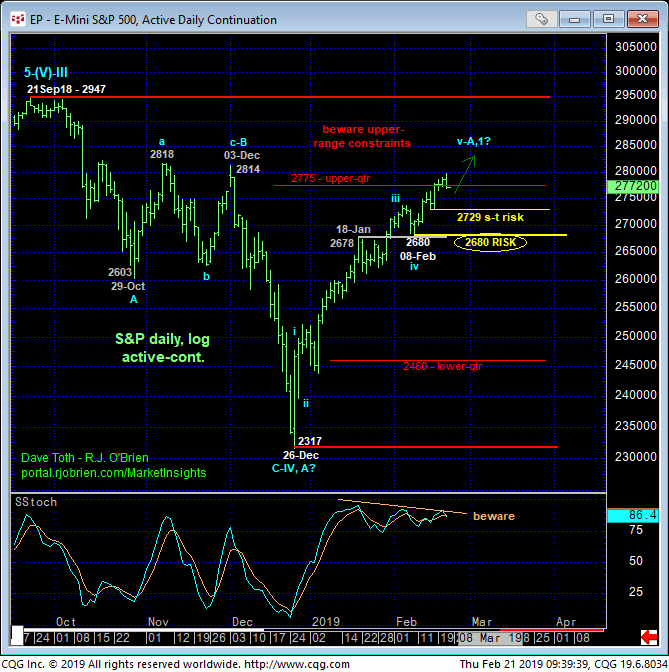

The past week’s continuation of the past couple months’ impressive recovery has leached into the upper-quarter of the past five months range where we want to be particularly watchful for a bearish divergence in even short-term momentum that could leave this market vulnerable to what could easily be a correction or reversal lower of potentially very uncomfortable scope. This recovery has been extraordinarily orderly, succeeding in sustaining every new high above a prior corrective low.
The past week’s latest spate of strength leaves 15-Feb’s 2729 low in its wake as the latest smaller-degree corrective low this market is minimally required to fail below to threaten the uptrend and warrant defensive steps by shorter-term traders with tighter risk profiles. 08-Feb’s 2680 low serves as the next larger-degree corrective low and new key risk parameter that even longer-term players should consider as a tight but objective risk parameter from which to rebase and manage the risk of a still-advised bullish policy “up here”.

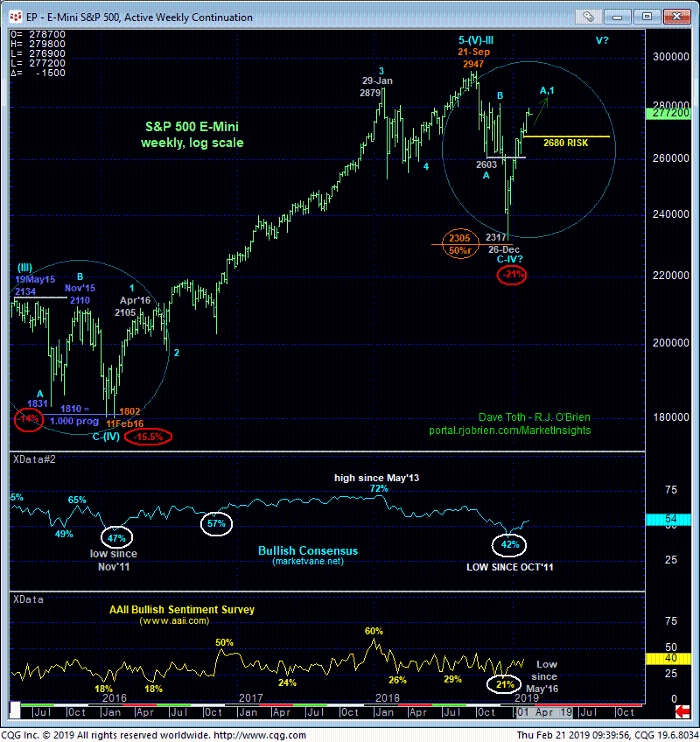
As extensive and impressive as the past couple months’ recovery has been and despite the clear 3-wave and thus corrective sub-division of Sep-Dec’s collapse that warns that 26-Dec’s 2317 low might have COMPLETED a major bull market correction ahead of a resumption of the secular bull, it would be premature to conclude the resumption of the bull until the market breaks 21Sep18’s obviously key 2947 all-time high. Until and unless such 2947+ strength is proven, this market could easily remain stuck within the 2947 – 2317-range for months or even quarters as a major correction continues more laterally than vertically. But even then, an eventual and likely emotional (C-wave) drubbing to the lower extreme of this range would not surprise before this correction ultimately ends and yields to the secular bull. Nov’15 – Feb’16’s scary and emotional meltdown that followed Aug-Nov’15’s even more extensive rebound then we’ve seen the past couple months provides an excellent example of the risks and deferral of the bull in the months and quarters ahead IF the current rally fails to sustain gains above prior corrective lows like 2729 and 2680.
These issues considered, a bullish policy and exposure remain advised ahead of further and possibly accelerated gains with a failure below 2729 required for shorter-term traders to step aside and commensurately larger-degree weakness below 2680 for even longer-term players to step aside.


