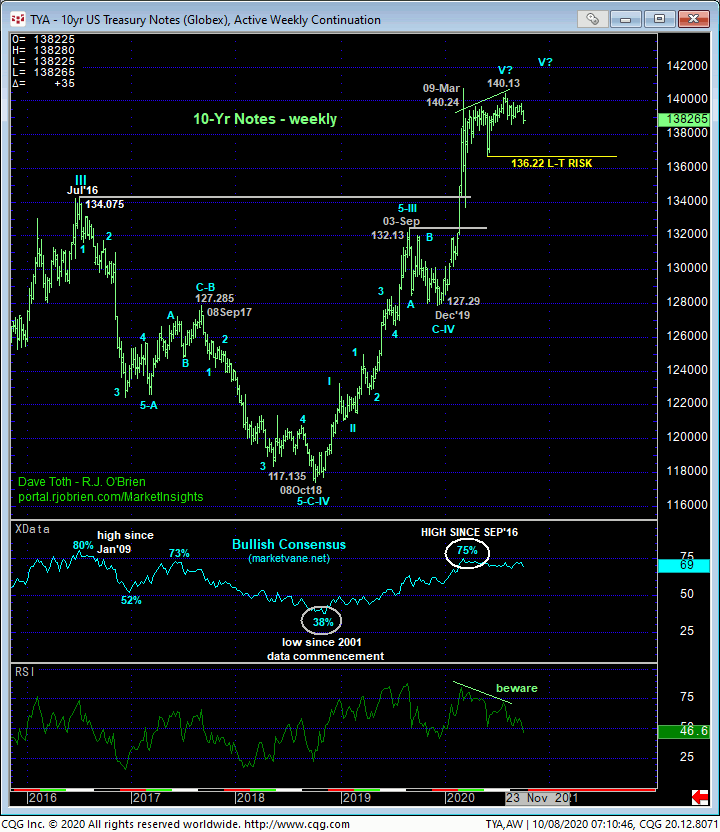
By virtue of yesterday’s continuation of the past week’s impulsive decline below Tue’s 138.23 low, the 240-min chart below shows that the market has defined Tue’s 139.06 high as the latest smaller-degree corrective high it now needs to sustain losses below to avoid confirming a bullish divergence in short-term momentum and stemming the slide from 29-Sep’s key 139.26 high. Per such, we’re identifying that 139.06 high as our new short-term risk parameter from which shorter-term traders with tighter risk profiles can objectively rebase and manage the risk of a still-advised bearish policy and exposure.
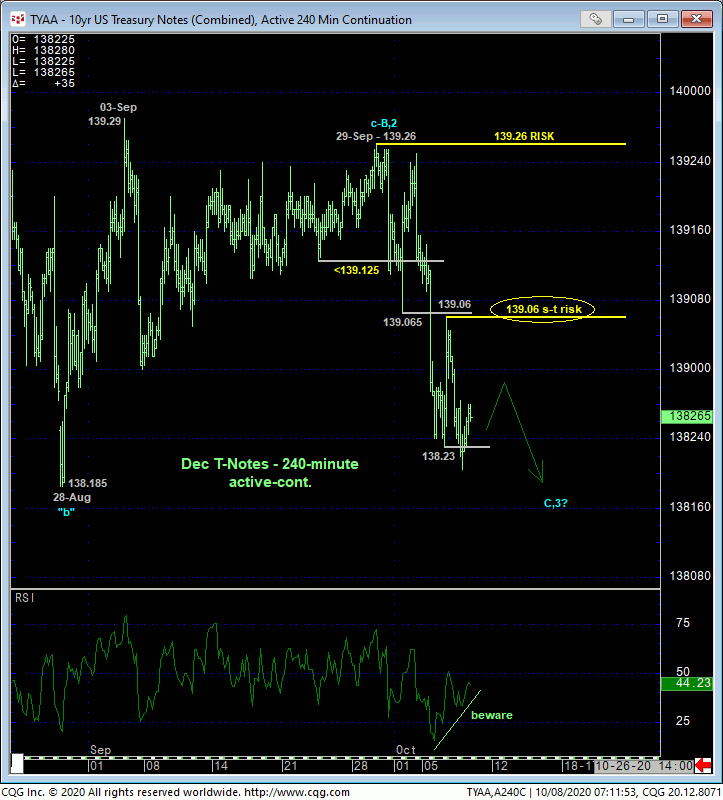
Stepping back a bit, this week’s resumed slide and rejection of the extreme upper recesses of a lateral range that spans the last six months reinforces our broader peak/reversal count introduced in 11-Aug’s Technical Webcast. Against the backdrop of what is now more than two months of peaking behavior and as a direct result of the extent and impulsiveness of the relapse from 29-Sep’s 139.26 high, we can define that high as our key risk parameter this market is required to recoup to render the sell-off attempt from 05-Aug’s 140.13 high a 3-wave and thus corrective affair and re-expose the secular bull trend. Until and unless such 139.26+ strength is shown, there’s no way to know the decline from that high isn’t the dramatic 3rd-Wsave of a reversal lower that we believe could be major in scope.
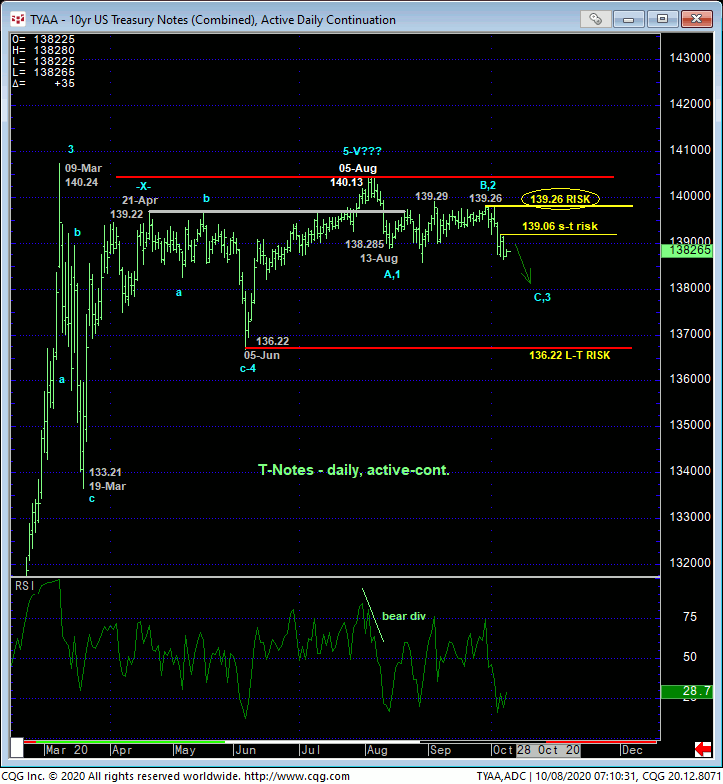
It’s interesting and reinforcing to note that, on a daily close-only basis below, this week’s break below 13-Aug’s 138.31 low stems from an exact 61.8% retrace of Aug’s initial counter-trend break from 140.105 to 138.31. To be sure, the decline from 04-Aug’s 140.105 all-time high close is THUS FAR only a 3-wave event. Against the backdrop of the secular bull trend from Oct’18’s 117.13 low, it’s not hard at all to consider the past couple months’ sell-off attempt as just another correction within the secular bull that’s got at least one more run ahead. HOWEVER, we know with specificity that this market has to close above 29-Sep’s 139.25 high and/or trade above that day’s 139.26 intra-day high to mitigate a broader bearish count and re-expose the bull. There is NO level below the market shy of 05-Jun’s 136.22 major corrective low and loooong-term risk parameter traders can consider as an objective one the market needs to trade below to mitigate a still-bullish position.
We recommend tightening bear risk to the levels identified above due to the market’s return to the middle-half bowels of the six month lateral range due to the increased odds of aimless whipsaw risk typical of such range-center environs that warrant a more conservative approach to risk assumption. Such an approach requires tighter but yet objective risk levels like 139.26 and even 139.06.
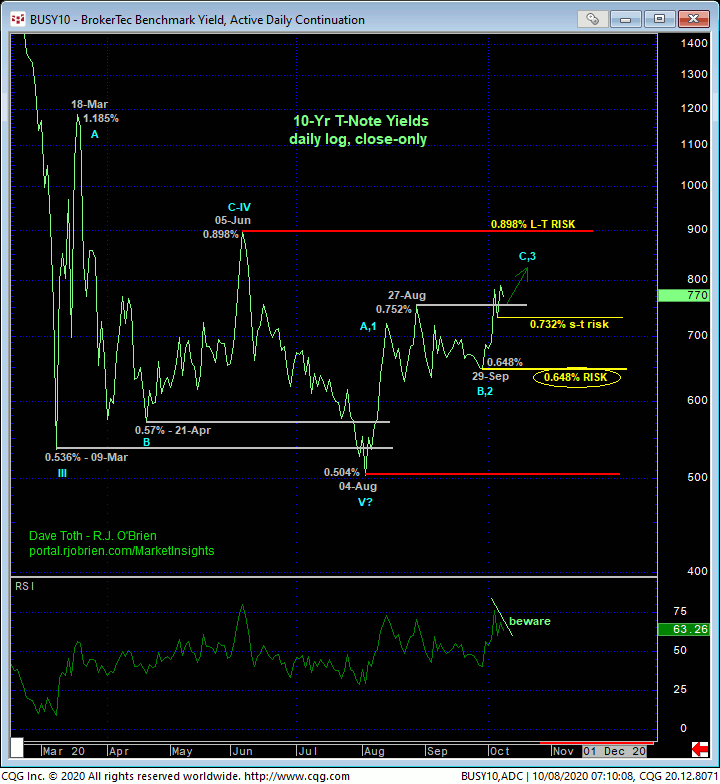
On a yield basis, the daily close-only chart below shows this week’s break above 27-Aug’s 0.752% high and resistance that leaves 29-Sep’s analogous 0.648% low in its wake as THE key risk parameter this market is now minimally required to relapse below to threaten a broader base/reversal count in rates. The developing potential for a bearish divergence in very short-term momentum is equally clear, with a short-term close below Tue’s 0.732% minor corrective low close required to confirm the signal and expose at least a correction of the portion of the rate rise from that 0.648% low.
From a much longer-term perspective, 05-Jun’s 0.898% high remains intact as perhaps this market’s single most important technical threshold as this is THE level this market needs to recoup to, in fact, break the secular bear trend in rates and expose a reversal that could be generational in scope.
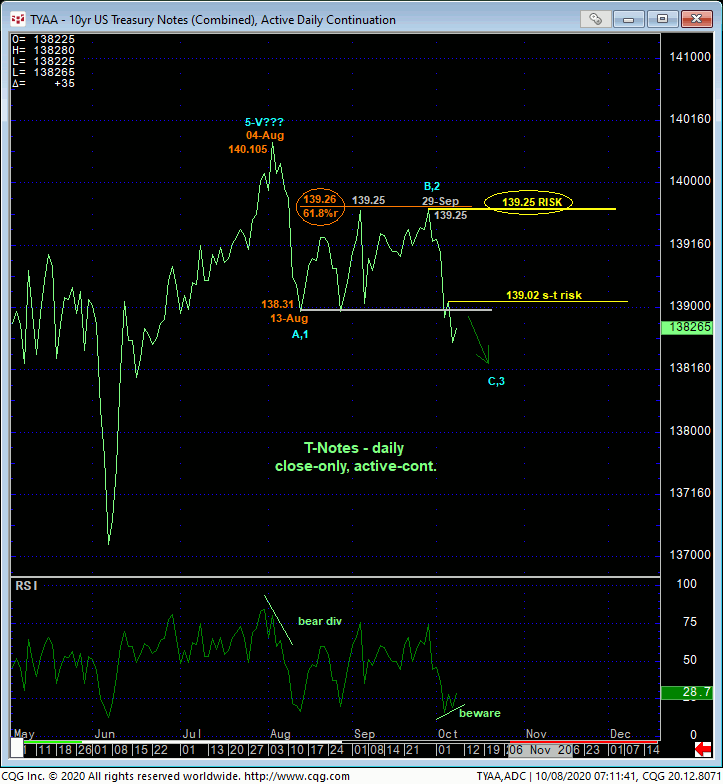
Finally, the weekly chart of the contract below shows the compelling confluence of factors on which our major peak/reversal is predicated:
- MONTHS of clearly waning upside momentum amidst
- historically frothy sentiment/contrary opinion levels that haven’t been seen since those that warned of and accompanied Jul’16’s major peak/reversal and
- an arguably complete 5-wave Elliott sequence up from Oct’18’s 117.13 low.
On this massive scale, commensurately larger-degree proof of weakness below 05-Jun’s 136.22 corrective low (above 0.898%) remains required to, in fact, break the secular bull trend. IF such an eventual reversal is unfolding from 05-Aug’s 140.13 high, then we would expect to see increasing evidence of trendy, impulsive, sustained losses in the period immediately ahead now that the market has broken below 13-Aug’s initial counter-trend low at 138.31. A recovery above 139.25 would NOT be consistent with this peak/reversal call. So the key directional flexion points and risk parameters have been well defined.
These issues considered, a bearish policy and exposure remain advised with a recovery above 139.06 required to defer or threaten this count enough for shorter-term traders to neutralize exposure and circumvent the heights unknown of a larger-degree but interim corrective rebound OR a resumption of the secular bull. Commensurately larger-degree strength above 139.26 is required for long-term players to follow suit. In lieu of such strength, further and possibly accelerated losses should not surprise with the lower-139-handle-area considered new near-term resistance.
