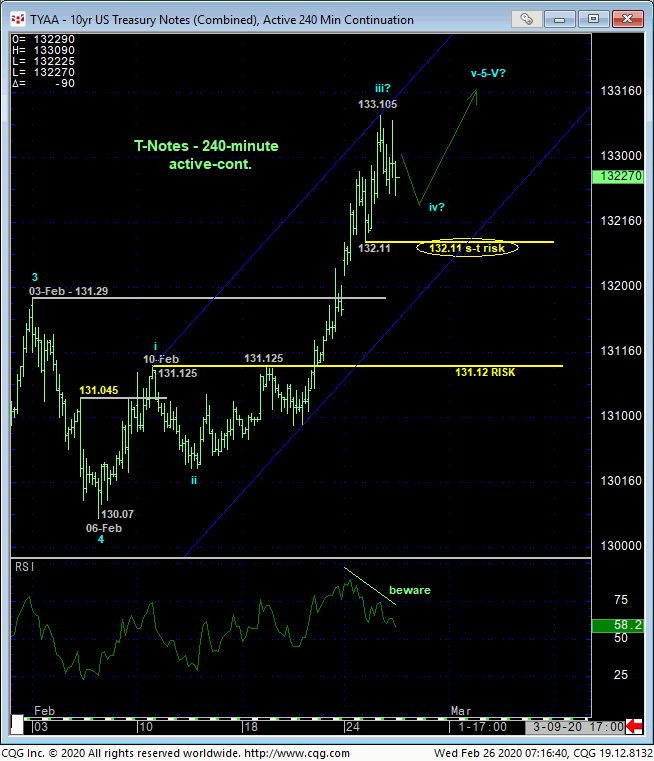
With yesterday’s continuation of the bull, the 240-min chart below shows that the market left a minor corrective low at 132.11 that we believe can now serve as a short-term risk parameter from which a still-advised bullish policy and exposure can be objectively rebased and managed by shorter-term traders with tighter risk profiles. A relapse below 132.11 will confirm a bearish divergence in short-term momentum. This would NOT be a scale sufficient to conclude a broader peak/reversal count, only another interim corrective hiccup. But with the market engaging historically low rates last seen in July 2016, a more conservative approach to risk assumption is warranted. And this 132.11 low provides the level around which to do so.
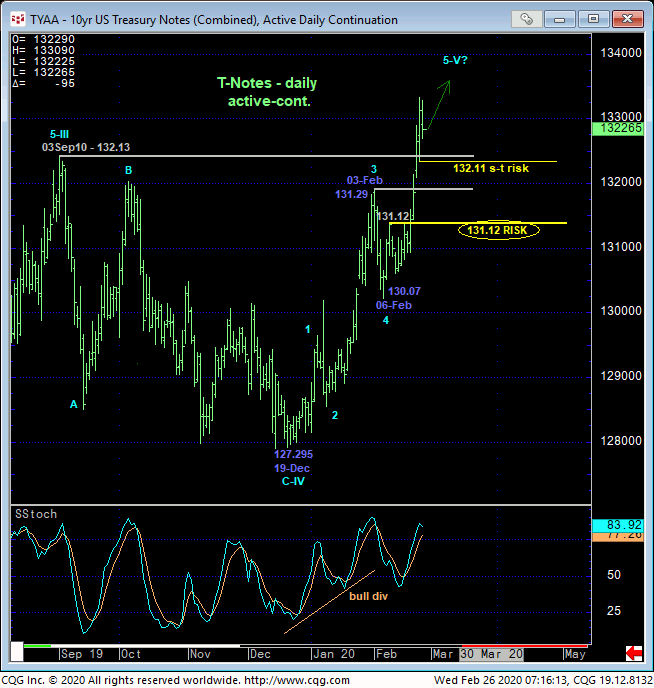
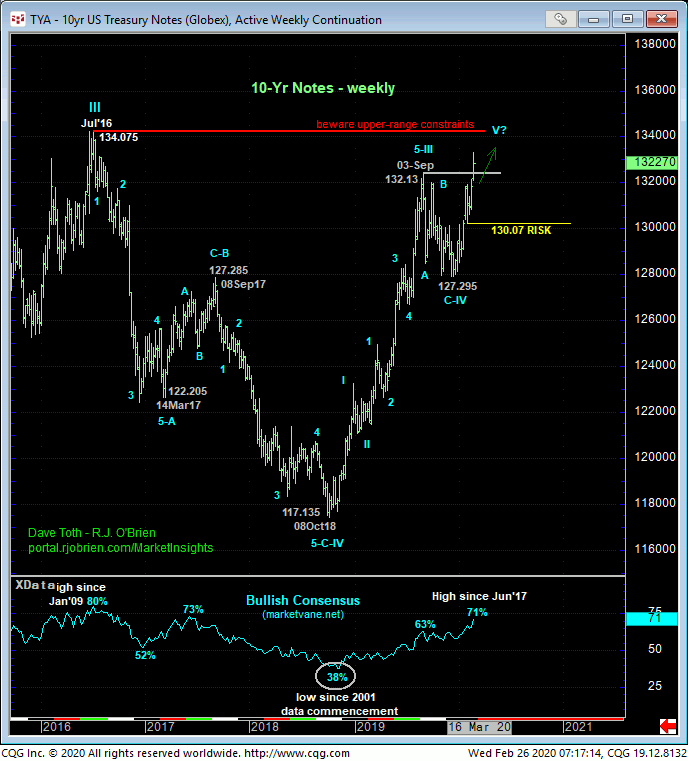
The daily chart above and weekly chart below detail the past coupe months’ resumption of the secular bull trend with this month’s portion of the bull from 06-Feb’s 130.07 low arguably the completing 5th-Wave of the sequence up from 19Dec19’s 127.295 low. Combined with historically frothy sentiment levels not seen since Jun’17 as well as the market’s proximity to Jul’16’s 134-1/4 all-time high, t’s not hard to find factors that are typical of major PEAK/reversal-threat environments. Nonetheless, the trend remains up on all scales and should not surprise by its continuance, with former 131-1/2-to-132.00-area resistance considered new near-term support. A failure below at least this 1/2-point range in general and below 10-Feb’s 131.12 (suspected minor 1st-Wave) high specifically is required to not only threaten the bull, but expose a peak/reversal environment that could be monstrous in scope, matching 2016’s major top and reversal in importance. Until and unless such weakness is shown, there remains no way to know how high “high” is, especially given the emotional and prospectively irrational moves of this and other markets.
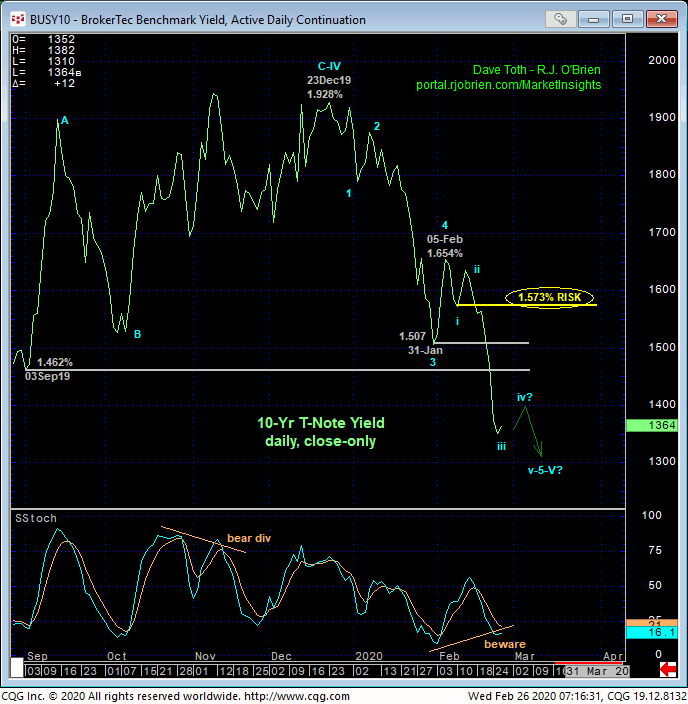
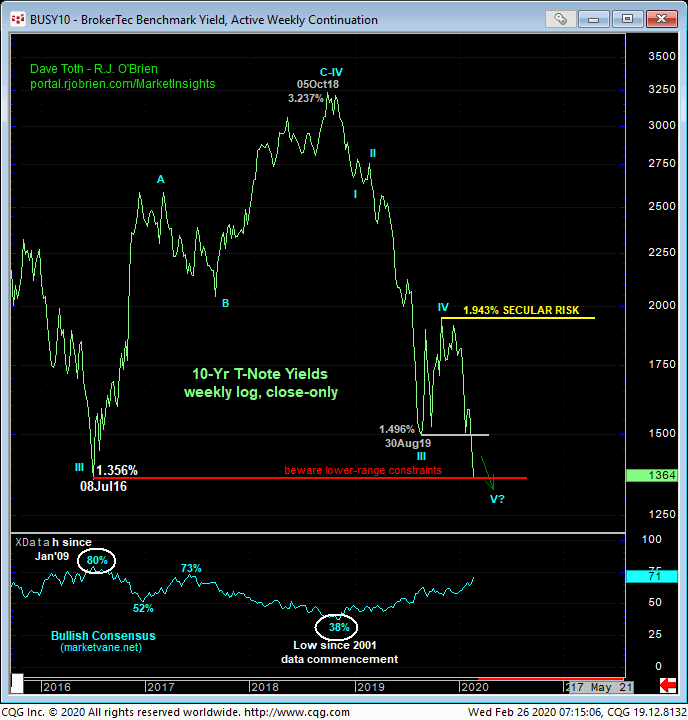
The daily close-only chart of 10-yr yields above shows the market’s clear break below a ton of former support from the 146%-to-1.51%-area that now serves as new key resistance. A recovery above this area in general and above 10-Feb’s 1.573% low specifically is required to threaten the secular trend down in rates and warn of a base/reversal threat identical, we believe, to July 2016’s major bottom in rates.
Indeed, the weekly log close-only chart of 10-yr rates below shows this week’s engagement of Jul’16’s 1.356% previous all-time low. Given that the major decline in rates began in Jul 1981 at an incomprehensible (by today’s standards) 15.64%, we are experiencing the resumption and potential end to a generational 39-YEAR trend, truly a historical event.
For similar long-term reasons, we not only do not expect rates to stay “down here” very long, we believe the risk/reward opportunity for long-term players is gargantuan. For the time being however, until and unless the market confirms a momentum failure to stem the clear and present downtrend in rates and uptrend in the contract, these trends are expected to continue and perhaps even accelerate.
These issues considered, a bullish policy and exposure remain advised with a failure below 132.11 required for short-term traders to are or neutralize exposure. Commensurately larger-degree weakness below 131.12 is required for long-term players to move to the sidelines and then consider a new bearish policy of looking to recovery attempts as selling opportunities. In lieu of such weakness, further gains remain expected.
