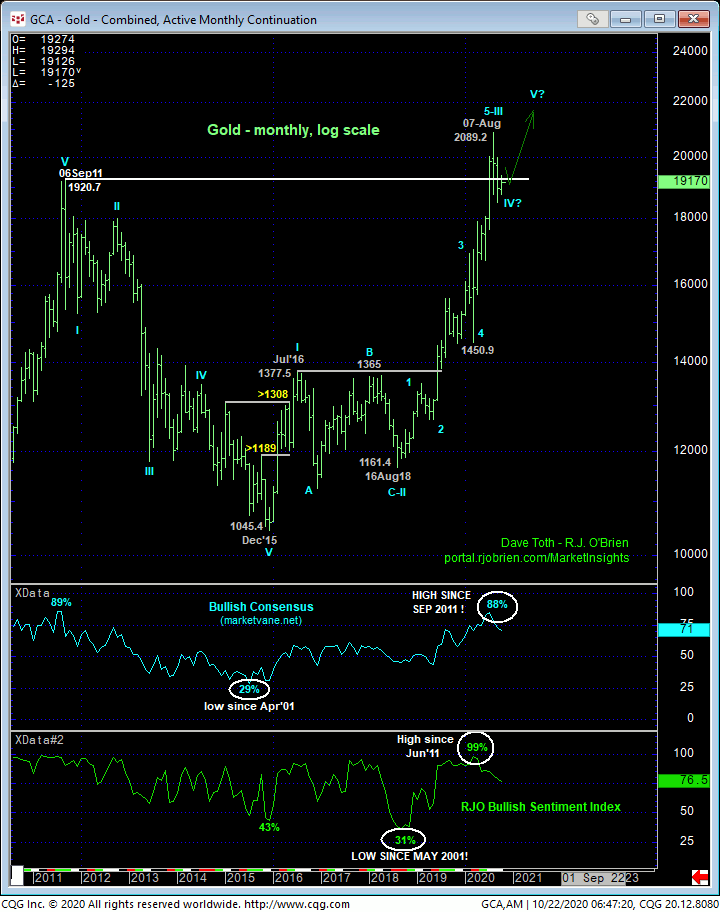
DEC GOLD
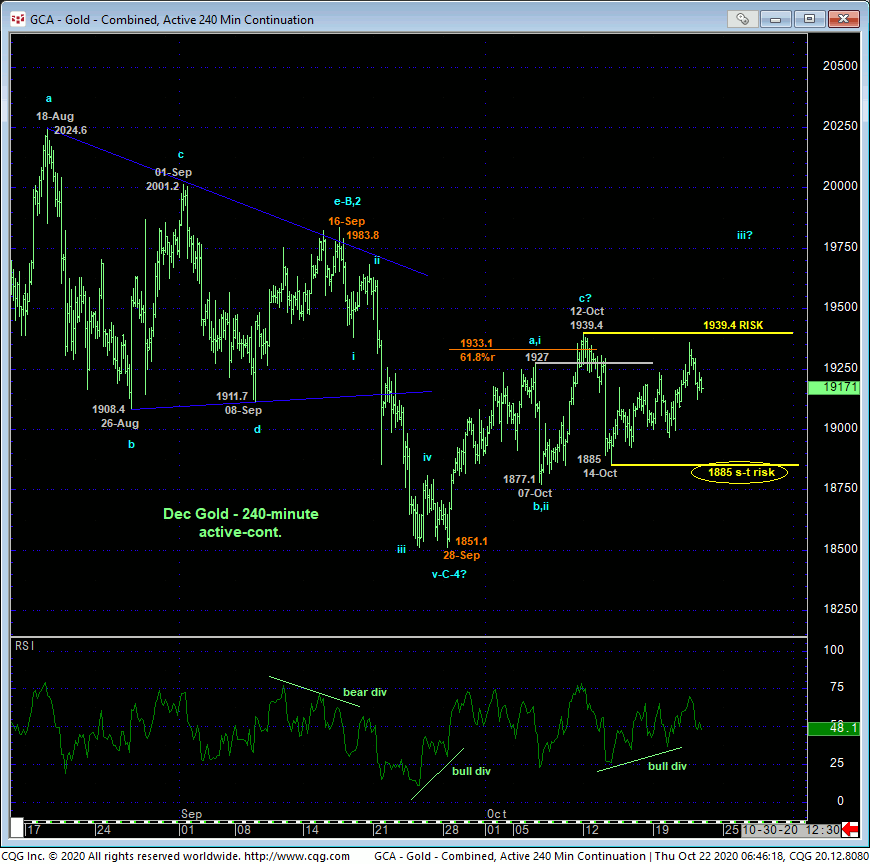
When the market closed below 25-Aug’s 1923.1 initial counter-trend low on 21-Sep, we discussed the prospect for it to fall apart in the 3rd-wave of a broader peak/reversal count in 22-Sep’s Technical Webcast. We also discussed the fact that the decline TO THAT POINT was only a 3-wave affair that could also easily be just a 4th-Wave correction within the still-arguable secular bull trend. Thus far, that key former support around the 1925-area, after being violated, has held as new resistance that would seem consistent with a broader bearish count. HOWEVER…..
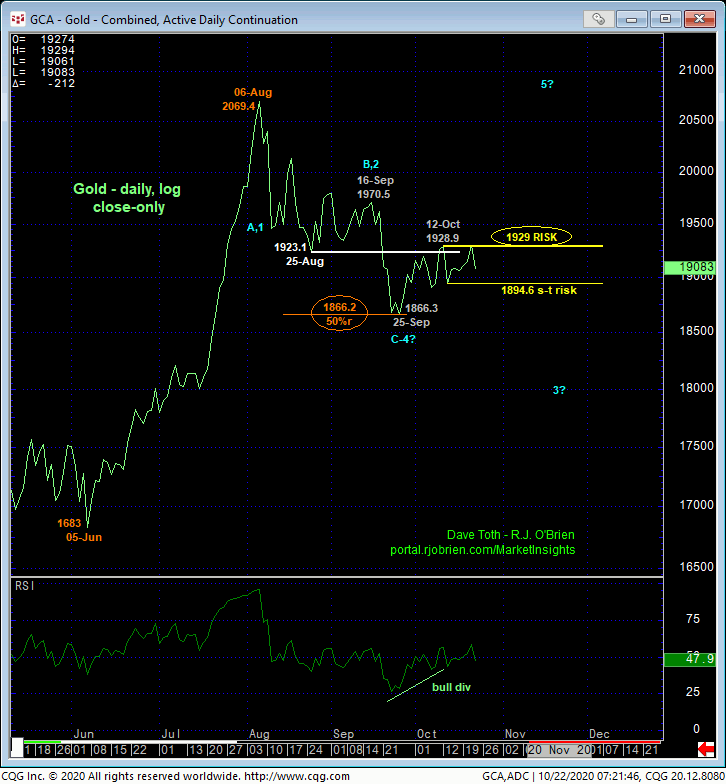
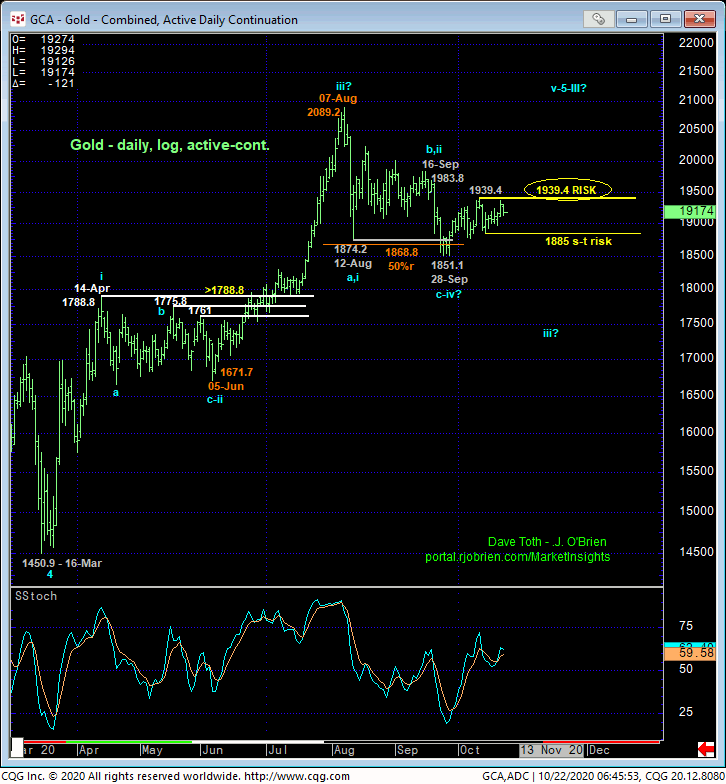
…both the daily close-only chart above and daily bar chart below show that this market just keeps hangin’ around and hangin’ around and hangin’ around, remaining close to a poke above 12-Oct’s 1939.4 high and a close above that day’s 1928.9 high close that we believe is a small but potentially pivotal step towards resuming the secular bull market. Indeed, Aug-Sep’s sell-off attempt stalled at the exact (1866.2) Fibonacci MINIMUM 38.2% retrace of Jun-Aug’s 1683 – 2069-portion of the secular bull in what, again, is only a 3-wave affair. Resecting a minimum Fib retrace arguably underscores the underlying strength of a market. A resumption of the past month’s recovery above last week’s highs and resistance would confirm at least the intermediate-term trend as up. But given these other factors (38.2% ret, 3-wave Aug-Sep slide, still-arguable secular bull), it is not hard at all to envision a resumption of the secular bullish count. Per such, we are tightening are longer-term bearish level to 1929 on a close-only basis and 1939.4 on an intra-day basis.
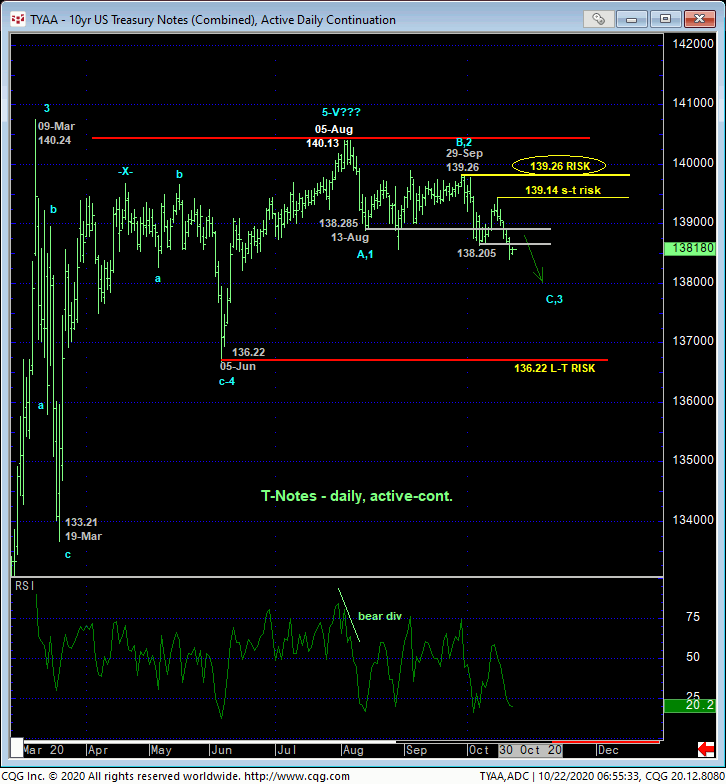
Fundamentally, it’s not hard to rationalize why this market hasn’t fallen off sharply, but rather maintains a bid: that little thing called a presidential election in less than two weeks, where gold is an obvious choice as a quality flight vehicle and/or one that could hedge against an inflationary scare. Pure quality flight would also typically include U.S. Treasuries. But in yesterday’s T-Note Technical Blog, we discussed reinforcing behavior to a major PEAK/reversal-threat environment shown in the daily chart above. This peak/reversal-threat behavior could be the T-note vigilantes’ (i.e. the entire world’s assessment of all things) bet that the money that has been infused into the U.S. economy thus far, and that could flood in even more if the Dems win the presidency and senate, will reinforce inflationary pressures down the road.
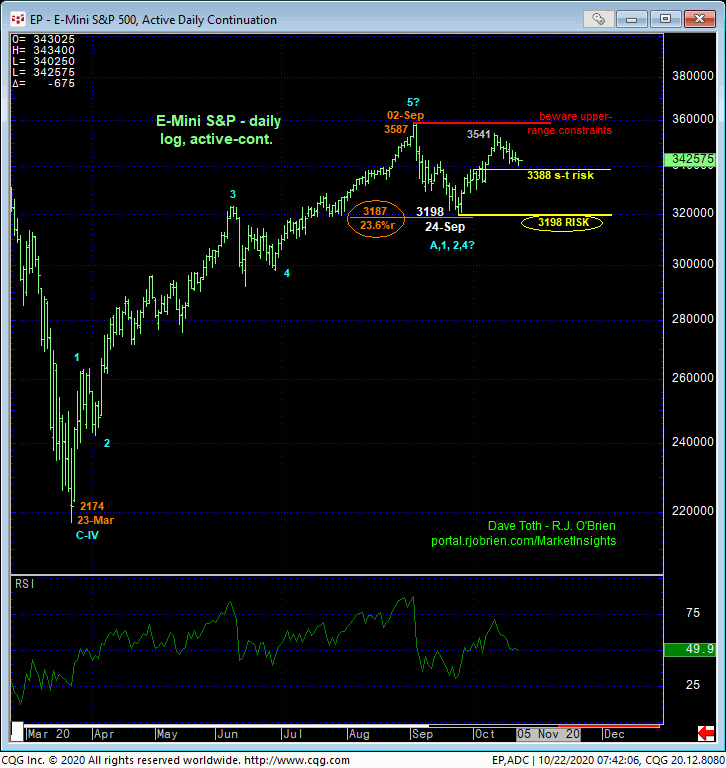
We’ve also discussed the critical need for the E-Mini S&P contract to sustain levels above 24-Sep’s crucial 3198 low shown in the daily log chart below. While the market sustains levels above 3198, the sell-off attempt from 02-Sep’s 3587 all-time high remains arguably corrective/consolidative within the secular bull trend. A break below 3198 will confirm a more protracted correction or reversal lower, the depths of which are indeterminable and potentially severe. Technically, there are no objective reasons to maintain a bullish policy and exposure on a sub-3198 break as we prefer to exchange whipsaw risk of neutralizing exposure (back above 3587) to totally unknown downside risk that, under current unique circumstances, could be severe.
If rates are headed higher and equities break, there likely remains only one game in town for one’s money: gold. We disdain and apologize for referring to prospective fundamental events to “rationalize” a technical count. This puts us in the company of bar room talk, chats with taxi drivers and IRA discussions with so-called advisors. In addition to the specific technical levels detailed in our analysis here however, we also included specific risk levels in the S&P and T-note markets around which our calls are reinforced or negated. We stress and take our objective cue from these and these only (with all due respect to our bar room buddies, taxi drivers everywhere and RIAs).
On a shorter-term basis, the 240-min chart of gold shows the past week’s recovery following a bullish divergence in short-term mo that leaves 14-Oct’s 1885 low in its wake as the latest smaller-degree corrective low the market needs to fail below to reinforce a bearish count that contends the recovery attempt from 28-Sep’s is a labored, corrective event within the context of a larger-degree move south. Per such, we are identifying this 1885 level as our new short-term risk parameter from which non-bearish decisions like short-covers and cautious bullish punts can be objectively based and managed.
This short-term chart details the importance of the two key flexion points we’ve defined at 1885 and 1939.4. Traders are urged to base directional biases and exposure around these levels commensurate with their personal risk profiles.
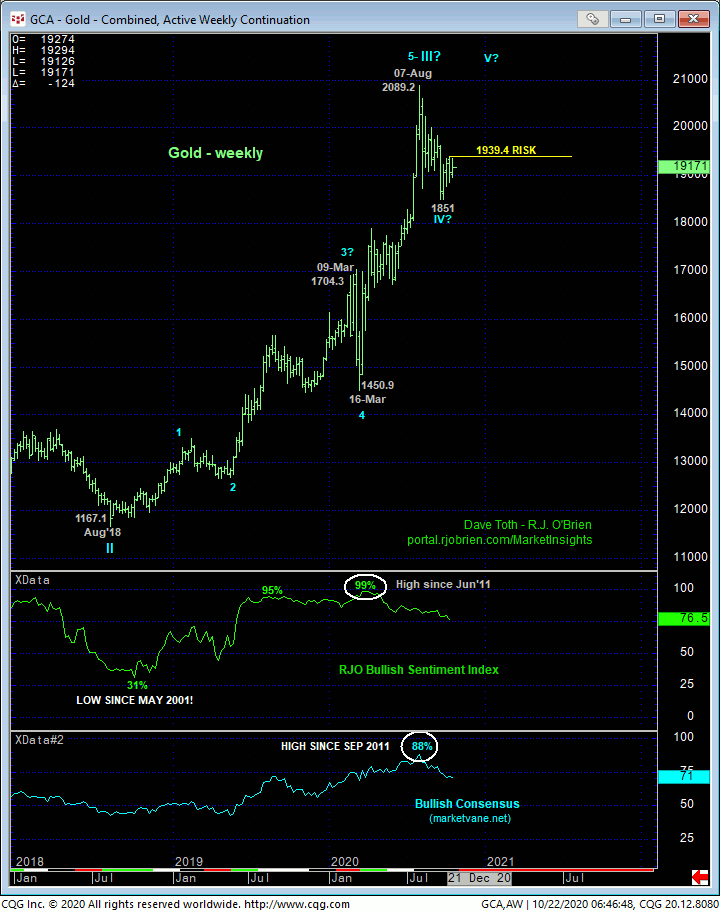
Finally, the weekly (above) and monthly (below) log scale charts show the magnitude of the secular bull trend. It is not hard at all to envision and consider Aug-Sep’s sell-off attempt as a mere (4th-Wave) correction ahead of a resumption of this massive uptrend. The fact that bullish sentiment has done nothing but erode for at least three months takes the frothy edge off the bull that can allow it to resume. In the case of our RJO Bullish Sentiment Index, the hot Managed Money community has been divorcing itself from bullish exposure since Mar!
These facts are far from am endorsement of the secular bull. BUT IF this market starts performing above the 1929-to-1940-area, the underpinnings are certainly there for the secular bull to resume, and potentially violently.
In sum, a cautious bullish policy is advised for shorter-term traders with a failure below 1885 required to negate this specific call and warrant its cover. Long-term players are OK to maintain a cautious bearish policy., with a close above 1929 and/or an intra-day recovery above 1939.4 required to not only cover exposure immediately, but to reverse a cautious bullish policy.
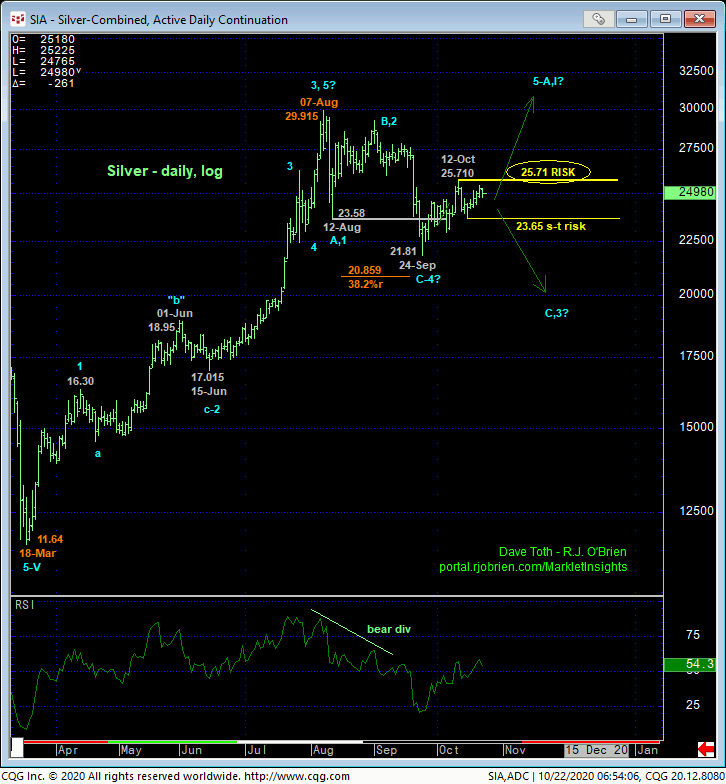
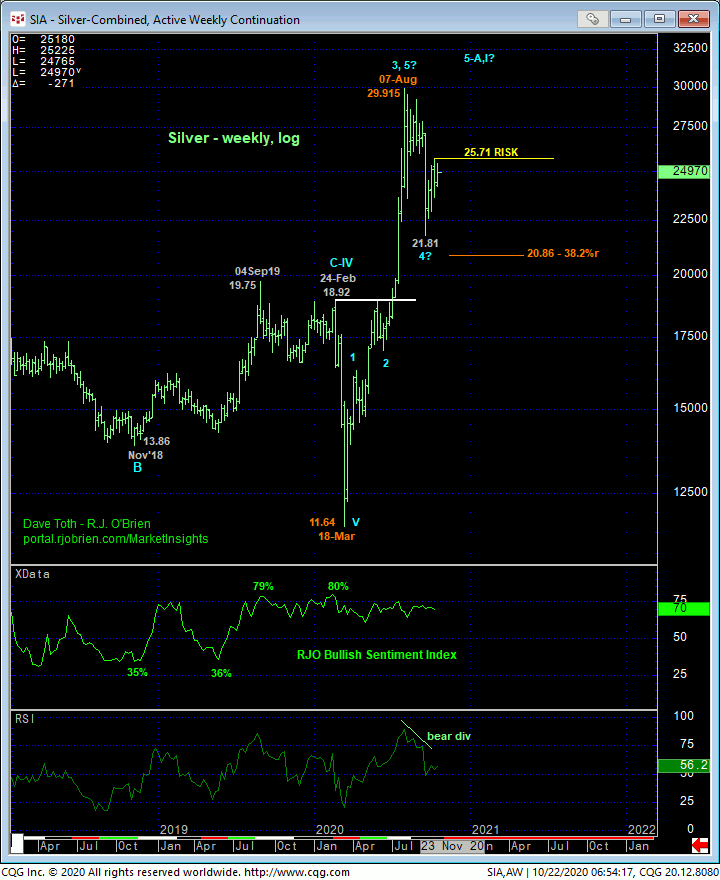
DEC SILVER
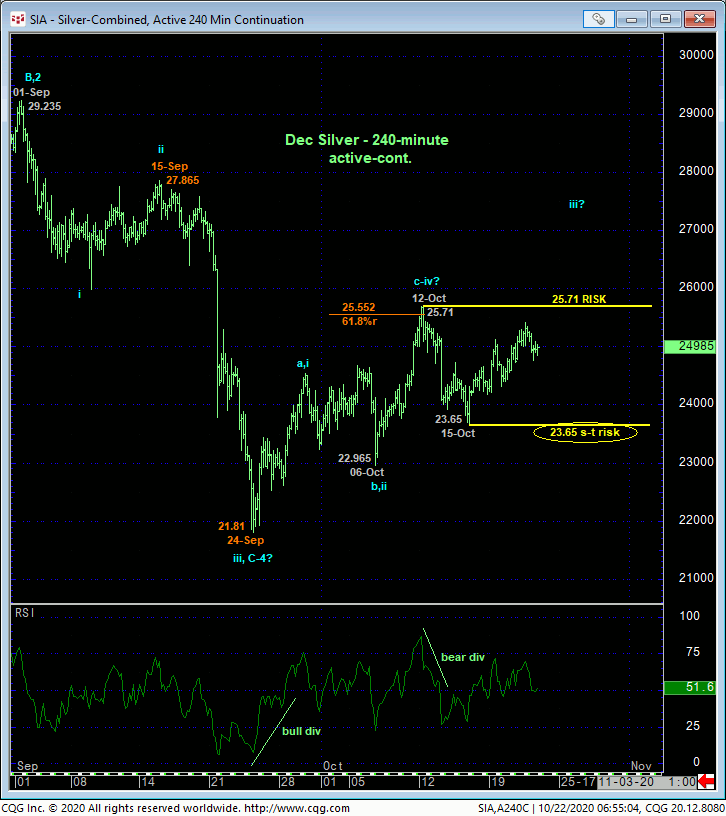
The technical construct and expectations for the silver market are identical to those detailed above in gold with 23.65 and 25.71 considered our key short-term bull and longer-term bear risk parameters and key flexion points around which to toggle directional biases and exposure.