MAY BITCOIN
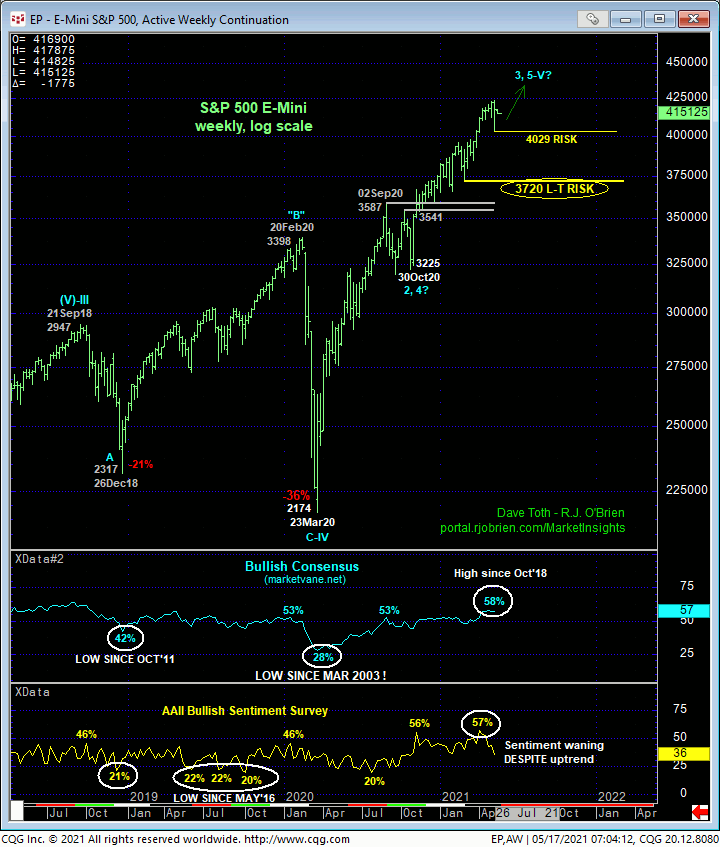
Today’s continued weakness, this time below last week’s 46395 low, reaffirms our major peak/correction/reversal count introduced in 23-Apr’s Technical Blog after that day’s bearish divergence in daily momentum threatened the major bull. In Thur’s Technical Blog, we identified 10-May’s 59900 smaller-degree corrective high as our new short-term risk parameter this market is minimally required to recover above to threaten a broader bearish count by rendering the entire sell-off attempt from 14-Apr’s 65520 key high a 3-wave and thus corrective affair that could then re-expose the secular bull trend. On an even tighter scales, the 240-min chart below shows that by virtue of today’s continued weakness, the market has identified Fri’s 51475 high as another smaller-degree corrective high the market would be expected to sustain trendy, impulsive losses below for a broader bearish count to remain a preferred call. Per such, this 51475 level serves as a micro risk parameter from which shorter-term traders with tighter risk profiles can objectively base non-bearish decisions like short-covers and cautious bullish punts. Until and unless this market recoups at least this 51475 threshold, further and possibly extensive losses straight away should not surprise.
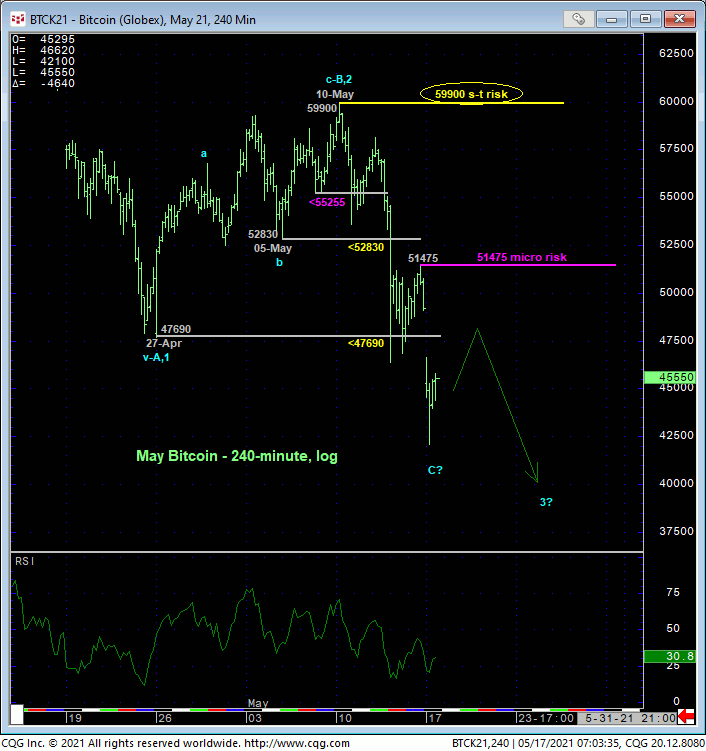
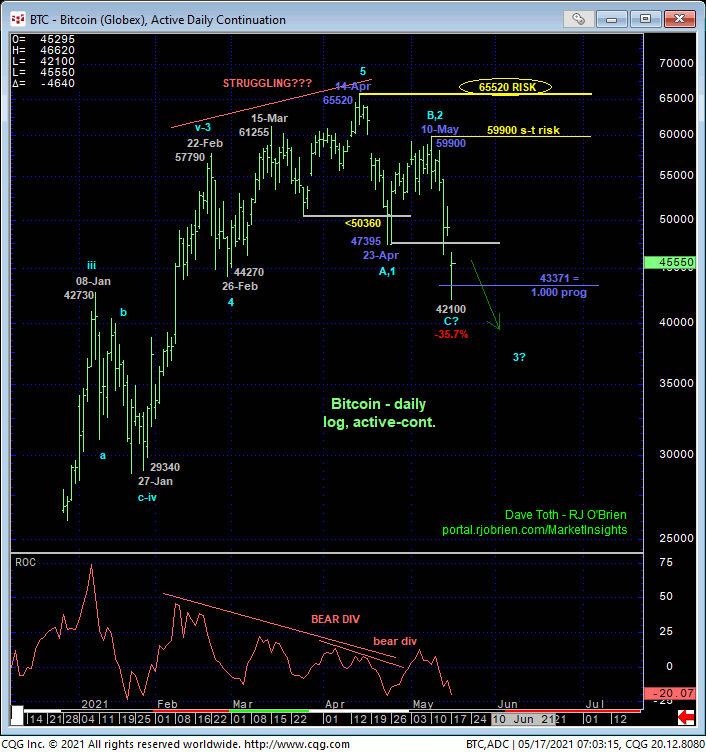
Taking a longer-term look, bitcoin has now lost 35.7% of its value from 14-Apr’s 65520 high. This would be the equivalent to a more than 1500-pt drop in the S&P to around 2725. Relative to the magnitude of the secular bull trend however, the weekly log scale chart below shows that this 35% setback is well within the bounds of a mere correction within the still-developing secular bull trend by only retracing a Fibonacci minimum 23.6% of Sep’20 – Apr’21’s 9850 – 65520 rally. And indeed, THUS FAR a least, the sell-off attempt from the Apr high has only unfolded three waves as labeled in the daily log scale chart above. IF the past month’s setback is a merely a correction however, it MUST start recovering above levels like 59900 even Fri’s 51475 high straight away. Until and unless it does and following nearly a month of an initial counter-trend break and subsequent corrective recovery, the decline from 10-May’s 59900 high must also be respected as the 3rd-Wave of a major reversal lower that would be expected to be devastating.
Per the May bitcoin specifically then, a bearish policy and exposure remain advised with a recovery above at least 51475 required to threaten this call and commensurately larger-degree strength above 59900 required to ere-expose the secular bull.
The reasons we’re associating today’s bitcoin analysis with our S&P analysis are twofold: first, on a weekly basis below, they’ve enjoyed a relatively positive correlation over the past year; secondly, and as major trends typically don’t evaporate overnight, we’d like S&P traders and equity investors to note mid-Apr’s initial (A- or 1st-Wave) counter-trend break in bitcoin (the first of our three reversal requirements followed by proof of 3-wave (B- or 2nd-Wave) corrective behavior on the subsequent recovery attempt that was confirmed as a correction on last Thur’s break below 23-Apr’s 47395 initial counter-trend low. For this exact reason, and as we’ll discuss below, we’re tightening our longer-term bull risk parameter in the E-Mini S&P to last Thur’s 4029 low.
JUN E-MINI S&Ps
In Thur’s Technical Blog, we acknowledged that day’s 4029 low as one of developing importance and the prospective end or lower boundary to a suspected (4th-Wave) correction within the secular bull trend because of:
- a bullish divergence in short-term momentum
- a prospect 3-wave and thus corrective decline from 10-May’s 4238 high
- a 50% retrace of 25-Mar-to-10-May’s (suspected 3rd-Wave) rally from 3843 to 4238 and
- the backdrop of the secular bull trend.
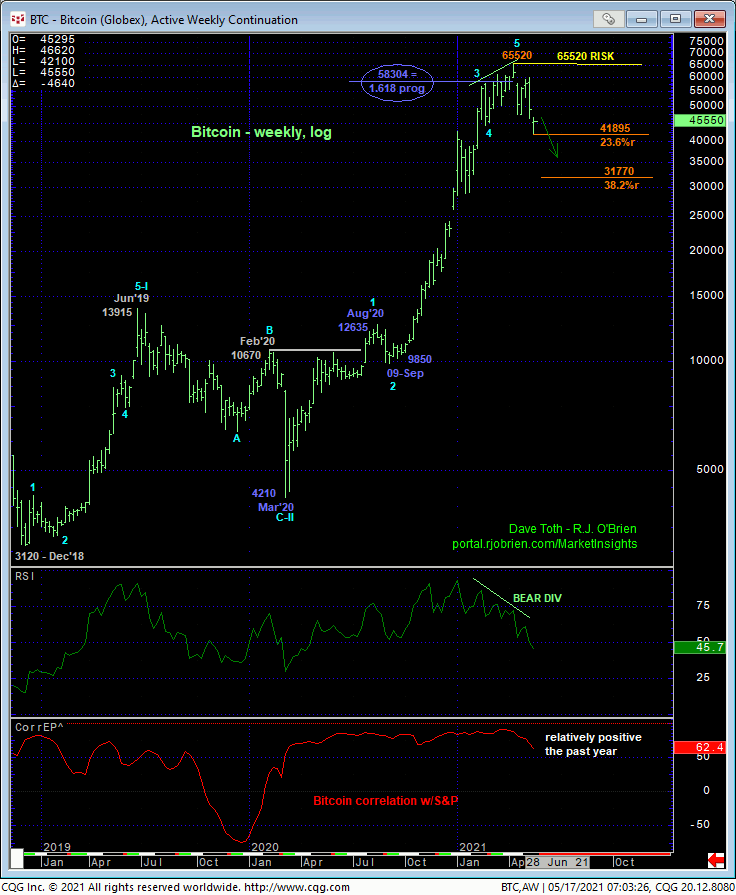
IF this call is correct, the market should not only not relapse below 4029, it should begin to exhibit sustained, trendy, impulsive price action higher. A relapse below 4029 would not be able to be ignored as a developing peak/correction/reversal threat that could become uncomfortable in scope. And in the interests in “better being out, wishin you were in, than in, wishing you were out”, even longer-term traders and investors would be advised to pare or neutralize bullish exposure below 4029 to circumvent the depths unknown of a larger-degree correction or reversal higher.
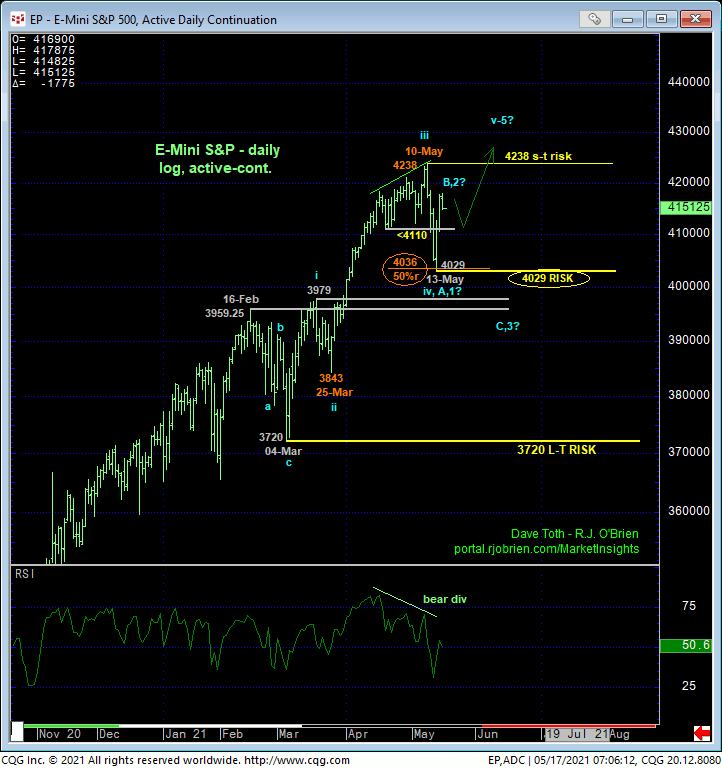
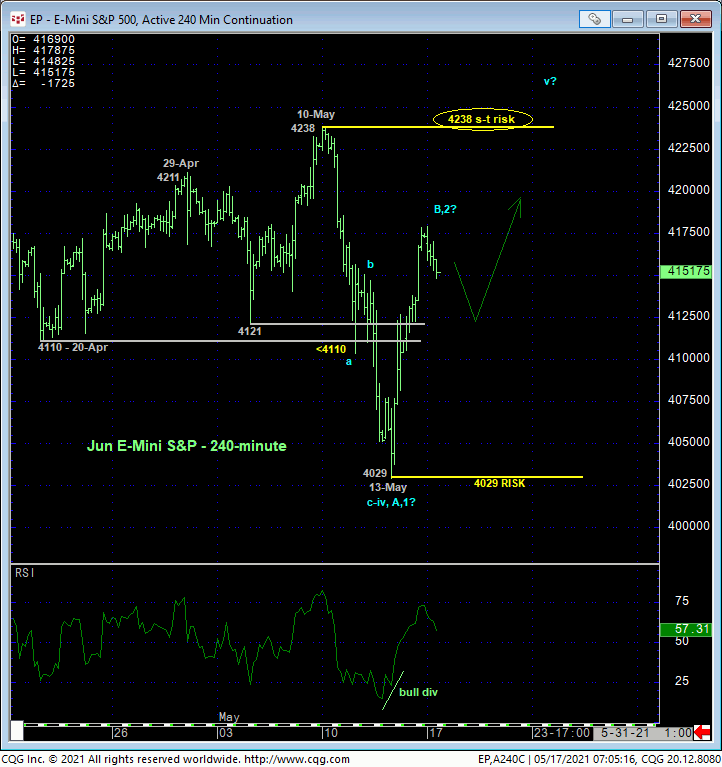
Stepping back to consider this market’s longer-term condition, indeed, the dominance of the secular bull trend, recent 3-wave-looking setback and exact 50% retrace of the portion of the bull from 25-Mar’s 3843 low to 10-May’s 4238 high has bull-market-correction written all over last week’s setback. And if this call is correct, the market should have no trouble not only sustaining levels above 4029, but behaving in an increasingly trendy, impulsive manner higher.
Given the magnitude of the secular bull, it would be grossly premature to conclude the death knell of the bull if the market fails below 4029. Indeed, it’s easy to see former resistance from the 3960-to-3980-range as a new support candidate, with commensurately larger-degree weakness below 04-Mar’s next larger-degree corrective low and key long-term risk parameter at 3720 required to break the uptrend from last Oct’s 3225 low. But we would not be able to RELY on any level below 4029 to hold in the absence of an accompanying confirmed bullish divergence in momentum needed to, in fact, arrest that decline. Said another way, there’s really no way to know the depth of a break below 4029. Per such, we’re tightening our longer-term bull risk parameter for all but the longest-term institutional players and investors to 4029.
To the upside, 10-May’s 4238 high remains intact as our short-term risk parameter the market obviously has to recoup to confirm the recent setback as corrective and reinstate the secular bull. The past five weeks’ erosion in the AAII Bullish Sentiment Survey would seem to reinforce this bullish call and that contingent would NOT be expected to be on the right side of a key top in the market. In effect, we believe the market has identified 4238 and 4029 as the key directional flexion points heading forward. We remain bullish from a long-term perspective with a failure below 4029 sufficient to threaten this call enough to warrant paring sharply or neutralizing altogether bullish exposure. A recovery above 4238 will confirm our suspicions that this setback is corrective and reinstate the secular bull to what could be fantastic heights thereafter. What the market has in store for us between 4238 and 4029 is anyone’s guess, and aimless whipsaw risk as the market consolidates laterally is a distinct possibility.
