Posted on Apr 13, 2023, 06:50 by Dave Toth

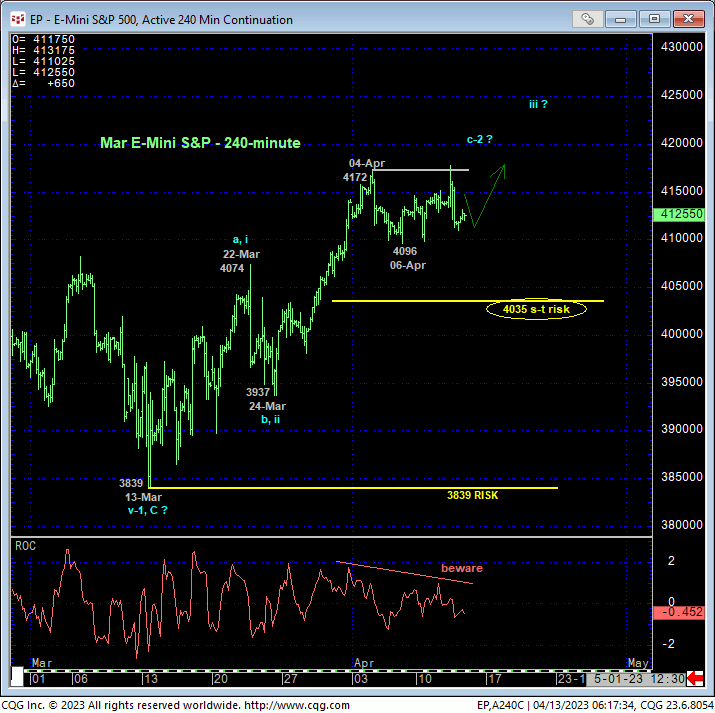
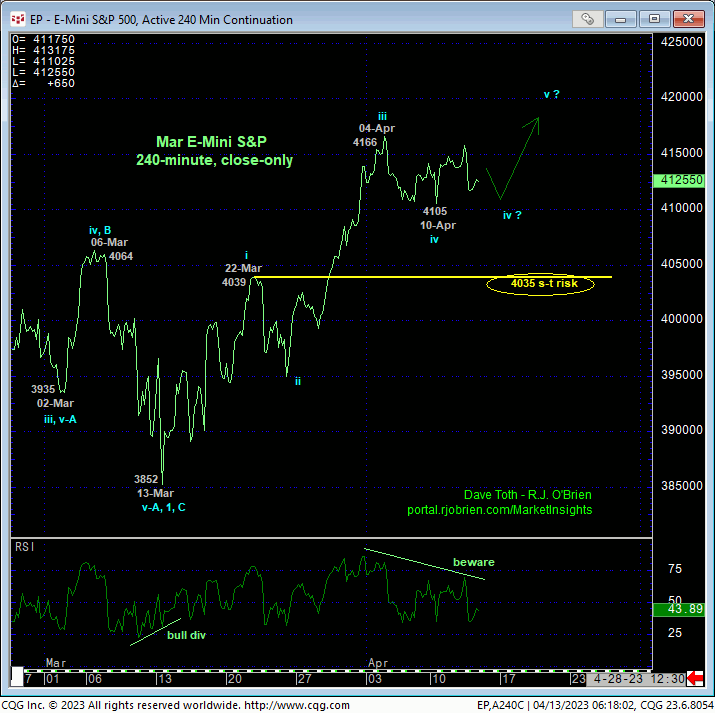
The market continues to perform laterally-to-higher per our latest update from 30-Mar. But as the market has nudged closer to the extreme upper recesses of the past four months’ range, tightening short-term bull risk is required. In both the 240-min high-low chart above and close-only chart below, upside momentum has been waning since 04-Apr. The lateral price action since then falls well within the bounds of a mere (suspected 4th-Wave) correction that warns of a (5th-Wave) resumption of the uptrend that preceded it. A relapse below 06-Apr’s 4096 low would CONFIRM a bearish divergence in momentum. However, still being above a preponderance of the price action up from 13-Mar’s key 3839 low, just a sub-4096 failure would be insufficient to conclude a broader top.
Rather, we’re defining 22-Mar’s 4039 high 240-min close as the end of a suspected smaller-degree 1st-Wave within an eventual 5-wave sequence up from mid-Mar’s low. IF a continued bullish count is correct, this market should come nowhere close to 4039, let alone break it. Per such, we’re defining 4035 as our new short-term bull risk parameter pertinent to shorter-term traders with tighter risk profiles. A failure below 4035 would jeopardize the impulsive integrity of a more immediate bullish count and at least throw the market back into the lateral range that has constrained it for the past four months. At most, such a sub-4035 rejection of the upper recesses of the 4-month range could be an early indication that the entire labored recovery from last Oct’s 3502 low is a 3-wave correction ahead of a resumption of last year’s major bear market.

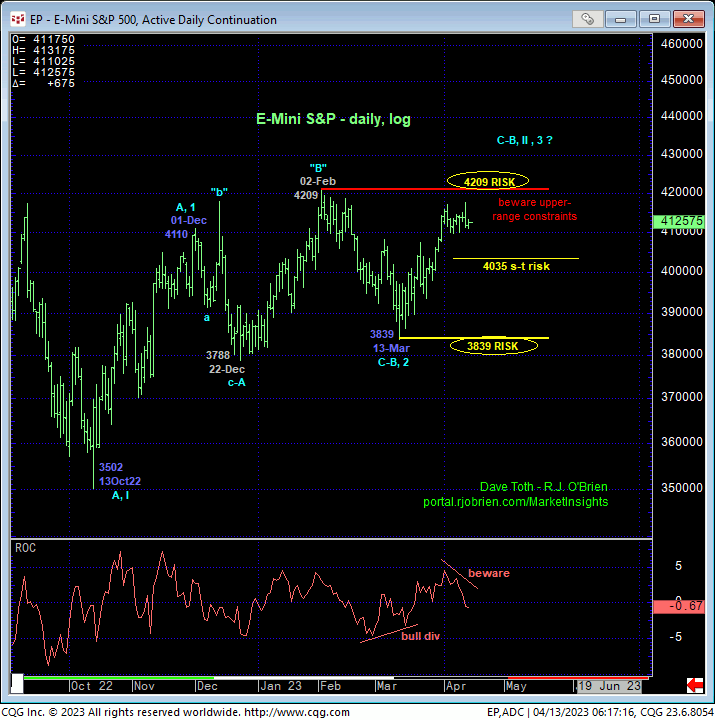
The daily log chart below shows the market’s precarious position at the extreme upper recesses of a lateral range that arguably dates back to even early-Dec. If there’s a time and place to be leery of at least another intra-range relapse like Feb-Mar, it is here and now. A slip below 4096 may be an early indication of such, but further weakness below 4035 should be required to break Mar-Ap’s recovery attempt.
This chart also shows the significance of 02-Feb’s 4209 high and upper-boundary of the range as well as 13-Mar’s 3839 low and lower boundary. A break of either of these key levels remains required to confirm and expose a larger-degree move in the direction of that breakout. Per such, traders and investors remain advised to acknowledge and be flexible to such challenging rangey environments where the odds of aimless whipsaw risk are approached as higher and the risk/reward merits of directional exposure are poor, warranting a more conservative approach to risk assumption.

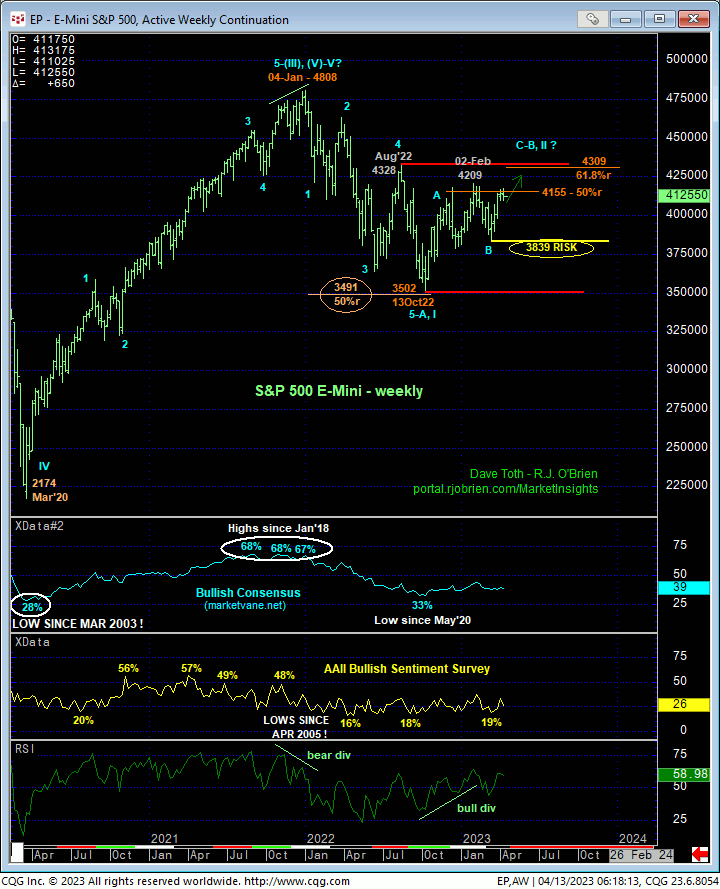
Lastly, long-term institutional players and investors are reminded that this market has thus far only retraced about 50% of 2022’s major bear trend from 04Jan22’s 4808 high to 13Oct22’s 3502 low. This remains well within the bounds of a bear market correction. But to resuscitate a broader bearish count, the market needs to relapse below at least 13-Mar’s 3839 larger-degree corrective low that would raise the odds that the recovery attempt from last Oct’s 3502 low is indeed a correction ahead of an eventual resumption of last year’s major bear market that preceded it. By contrast, a break above 02-Feb’s 4209 high will reaffirm the recovery and perhaps expose a run at the 61.8% retrace of last year’s bear around the 4309-area or higher.
These issues considered, a cautious bullish policy remains advised with a failure below 4035 required to threaten this call enough to warrant flipping the script to a cautious bearish policy. In lieu of such sub-4035 weakness, further lateral-to-higher prices are expected.


