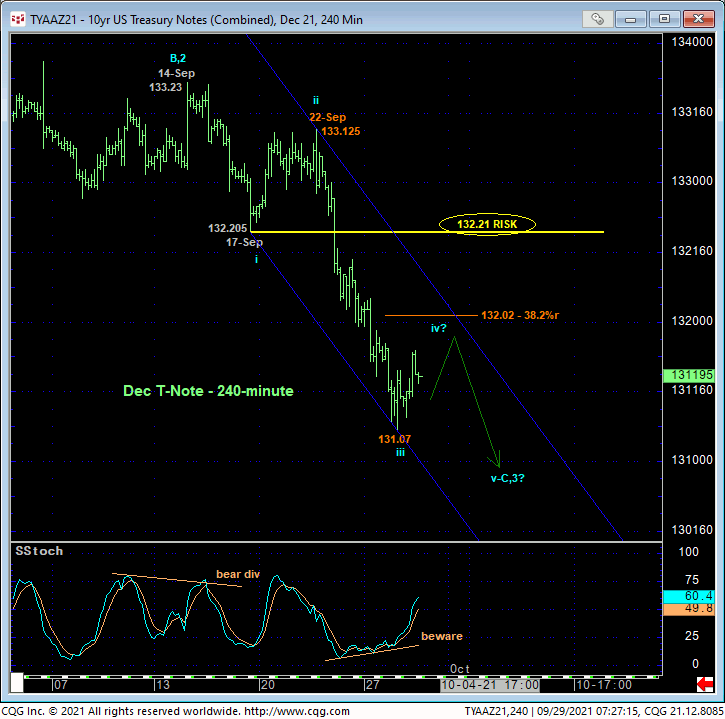
The extent and impulsive manner of the past week’s plunge confirms our bearish count discussed in 17-Sep’s Technical Blog and leaves a key area of former support around the 132.21-area as a new and considerable resistance area the market should not even come close to now per a more immediate bearish count. In the 240-min chart below, we’re defining 17-Sep’s 132.205 intra-day low as the end of a minor 1st-Wave down as part of an eventual 50-wave sequence down from 14-Sep’s 133.23 high. In order to negate the impulsive integrity of this count, the market needs to recover above 132.21, so we’re defining that level as our new key bear risk parameter from which a still-advised bearish policy and exposure can be objectively rebased and managed.
If this count is correct, the bounce from yesterday’s 131.07 low is advised to first be approached as a smaller-degree (perhaps 4th-Wave) correction within the developing slide. If the past week’s weakness is part of a more immediate bearish count and breakdown below 05-Apr’s 130.25 low, we’d expect any corrective bounce to be relatively minor, like perhaps only to the area of the (132.02) 38.2% retrace of the suspected 3rd-Wave decline from 133.125 to 131.07.


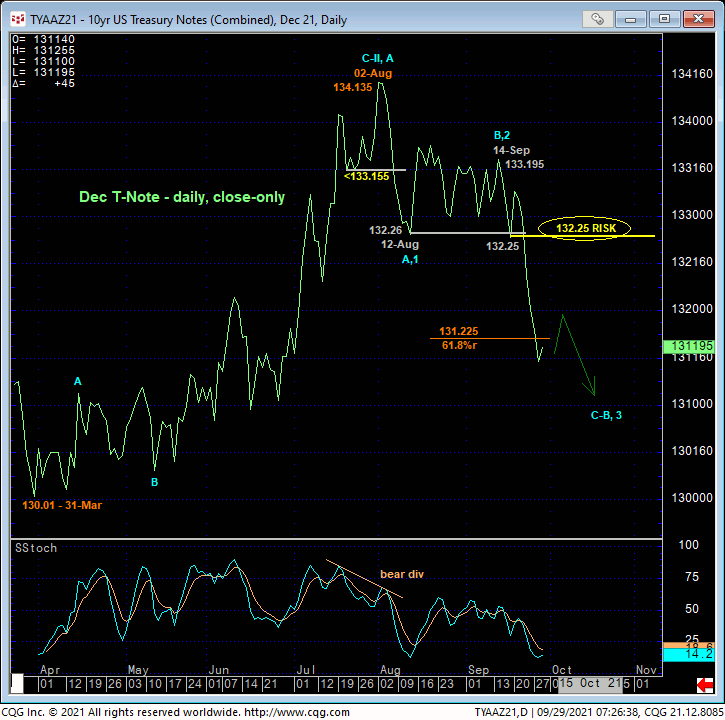
The daily close-only chart above shows the pertinence of the 132.25-area support-turned-resistance as well as the past couple weeks’ (C- or 3rd-Wave) resumption of Aug’s initial (A- or 1st-Wave) downtrend. Again, if the decline from 14-Sep’s 133.195 high is the 3rd-Wave of an eventual 5-wave sequence down, this market should not be able to come anywhere near that 132.25-area. This is why we’ve trailed a longer-term bear risk parameter to 132.21 on an intra-day basis and 132.25 on a closing basis.
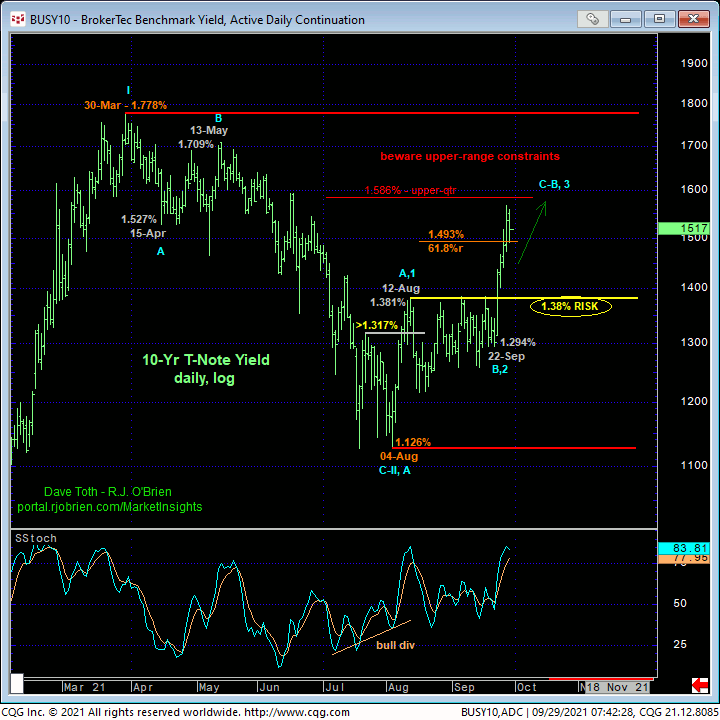
Relevant to this decision to trail bear risk in the contract to such a more conservative level is the market’s encroachment on just the upper-quarter of the past six months’ range on a yield basis below. Unless this market sustains trendy, impulsive behavior higher (in rates) per a 3rd-Wave, it’s not hard at all to consider the intra-range recovery from 04-Aug’s 1.126% low as a prospective B-Wave within a consolidative range that may have months to go and include another intra-range (C-Wave) relapse to the lower recesses of the range below 1.20%. HOW this market behaves- either sustaining trendy, impulsive behavior higher OR rolling over in a momentum failure- “up here”, at the upper-quarter of the yield range will be critical to either a more immediate count calling for much higher rates OR one in which rates waft laterally between 1.60% and 1.20% for weeks or months ahead.

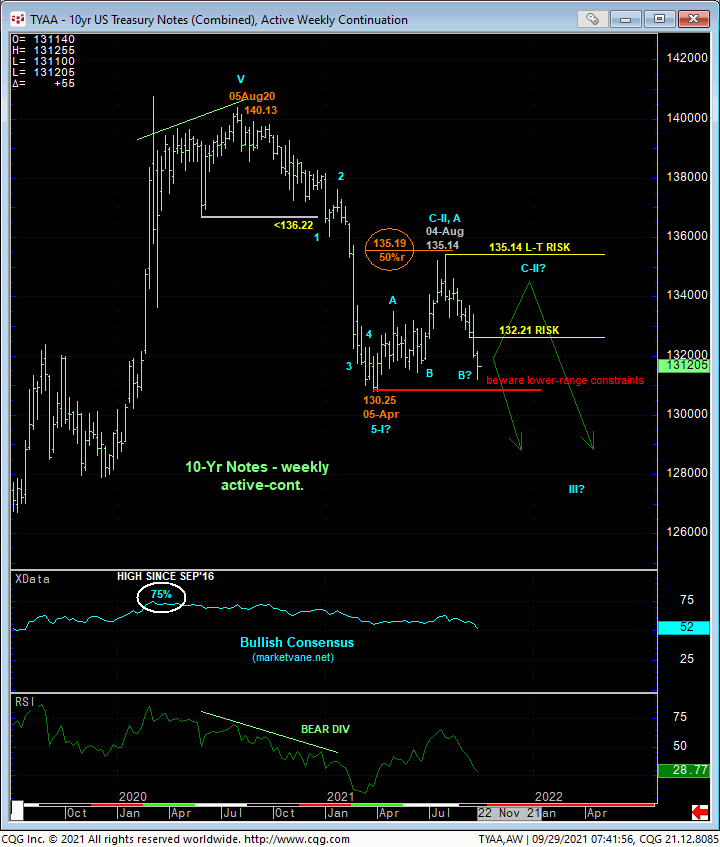
The weekly active-continuation chart below shows the contract’s close proximity to 05-Apr’s 130.25 low, the break below which could leave the market prone to steep losses thereafter per our massive peak/reversal count from Aug’20’s 140.13 high. But due to basis differences over the past six months, 30-Mar’s 1.778% high is a more considered key flexion point than 130.25 in the contract.
These issues considered, a bearish policy and exposure remain advised with a recovery above 132.21 required to negate this specific count and warrant its cover. We will be watchful in the days and weeks ahead for a developing bullish divergence in momentum on a shorter-term scale that would provide an early clue to another intra-range rebound and identify a tighter risk parameter than 132.21.


