Tightening directional risk parameters reduces the amount one risks on a directional play, but this benefit comes in exchange for taking on whipsaw risk. Nonetheless, as the market’s range has narrowed over the past two weeks, this is what we are advocating for shorter-term traders with tighter risk profiles.
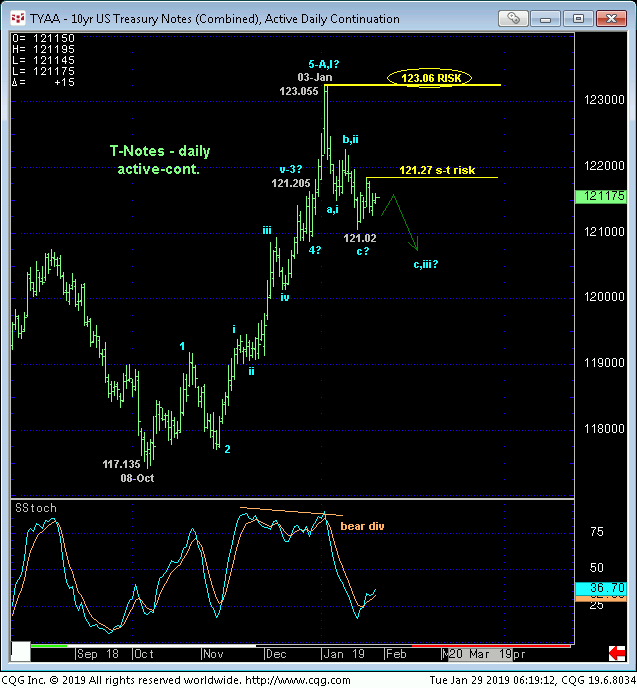
In 04-Jan’s Technical Blog following that day’s bearish divergence in short-term momentum, we introduced the bearish prospect that 03-Jan’s 123.055 high completed the rally from 08-Oct’s 117.135 low, exposing either a more significant correction OR reversal lower. From a longer-term perspective it’s easy to see the significance of that 123.055 high as a key risk parameter to non-bullish decisions like long-covers and new bearish exposure in the daily chart below. But as this month’s relapse has THUS FAR only unfolded into only a 3-wave structure, we cannot ignore the prospect that this setback to 18-Jan’s 121.02 low completed a (4th-Wave) correction ahead of a resumption of Oct-Jan’s uptrend.

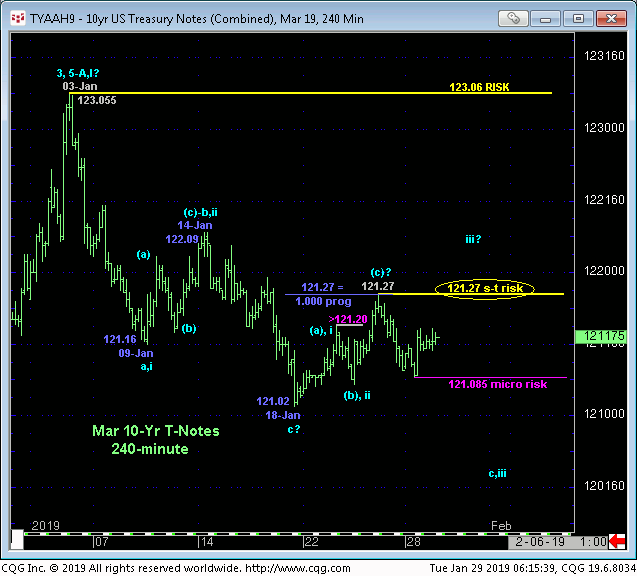
Drilling down to an intra-day 240-min chart below, Fri and yesterday’s relapse renders the prior recovery attempt from 18-Jan’s 121.02 low to last week’s 121.27 high a 3-wave event that spanned an identical length (i.e. 1.000 progression) to 09-to-14-Jan’s 3-wave correction that led to a resumption of the downtrend that preceded it. While 24-Jan’s 121.27 high remains intact, we anticipate a similar downtrend resumption that will be reinforced by a break below yesterday’s 121.085 low. Per such, this 121.27 high is considered our new short-term risk parameter to a still-advised bearish policy and exposure for shorter-term traders.
A recovery above 121.27 will negate this specific count, confirm at least the intermediate-term, trend as up and expose at least a more significant attempt at 03-Jan’s 123.055 high and possibly a resumption of Oct-Jan’s longer-term uptrend to new highs above 123.06. For scalpers, one can objectively position for such a bullish outcome with very tight protective sell-stops just below 121.085. In effect, 121.27 and 121.08 become admittedly tight but important triggers around which directional biases and exposure can be effectively based and managed.

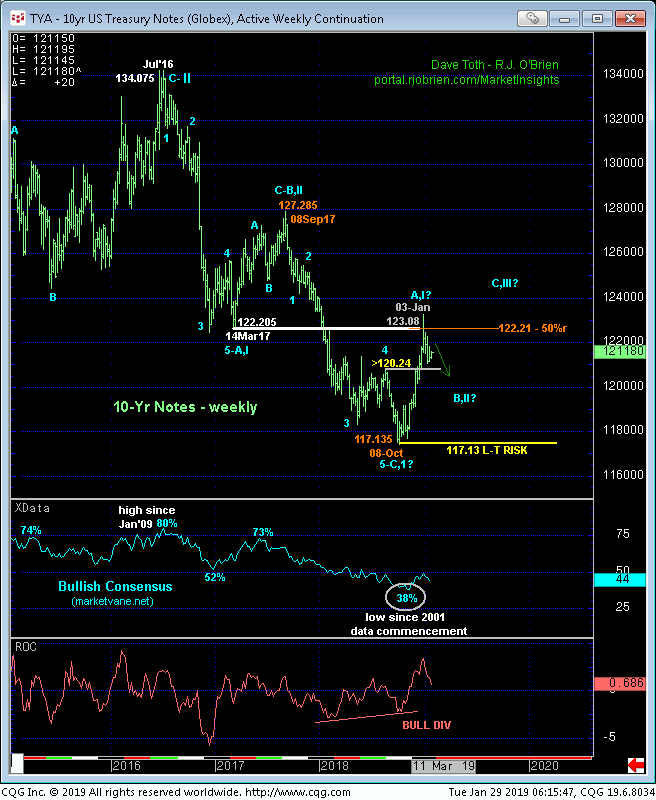
In that early-Jan discussion we discussed the 122-3/4 – 123.00-area as one to be watchful for peak/reversal-threat behavior to stem 4Q18’s rally. Thus far price action has reinforced this count and still warns of a more significant correction or reversal lower. But given the extent and (5-wave) impulsiveness of this rally, we have to remain suspicious that this rally is just the INITIAL (A- or 1st-Wave) salvo of a more significant correction that’s yet to follow. But “more significant” may come in the form of TIME rather than price, with the market potentially confined to the Oct-Jan range between 117-1/2 and 123-1/4 for many more months before the secular bear trend resumes.
This is important to equity traders/investors as well given the generally negative correlation between T-note prices and equity prices. A recovery above our short-term risk parameter in TY-notes at 121.27 is more than likely to correlate with a short-term mo failure in Mar S&Ps below 2612discussed in 25-Jan’s S&P Technical Blog.

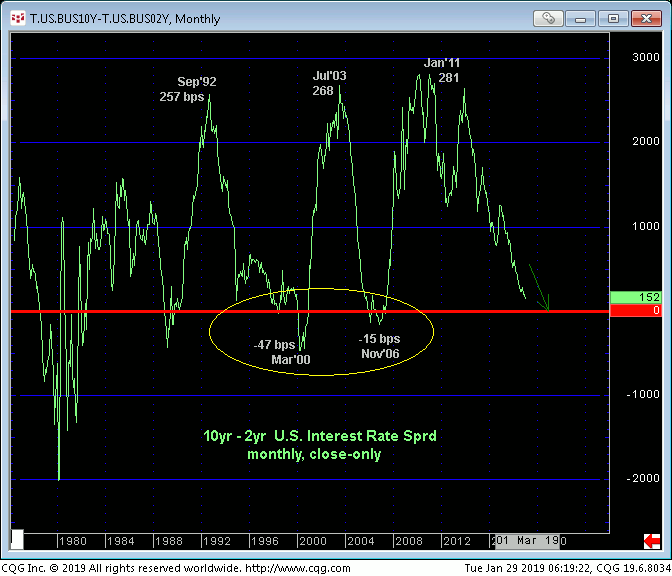
Finally, with respect to a deferral of a bullish count in S&Ps (and correlated resumed bullish count in T-notes), the 2-yr-to-10-yr T-Notes spread shown in the monthly chart below has shown no signs of abating its trend towards inversion. This doesn’t bode well for a more immediate and sustained continuation of an S&P bull. Rather, it would seem to better reinforce a count calling Jan’s S&P rebound just an interim, intra-four-month-range pop ahead of further lateral-to-lower prices in the months ahead. Such equity prices would more than likely maintain a relative floor under T-note prices. Just something to think about in the overall navigation of these two markets in the months ahead.
These issues considered, a bearish policy remains advised with strength above 121.27 required for shorter-term traders to move to the sidelines and longer-term players to pare bearish exposure to more conservative levels. In lieu of such 1221.27+ strength and especially following a break below 121.08, further and possibly accelerated losses should not surprise.


