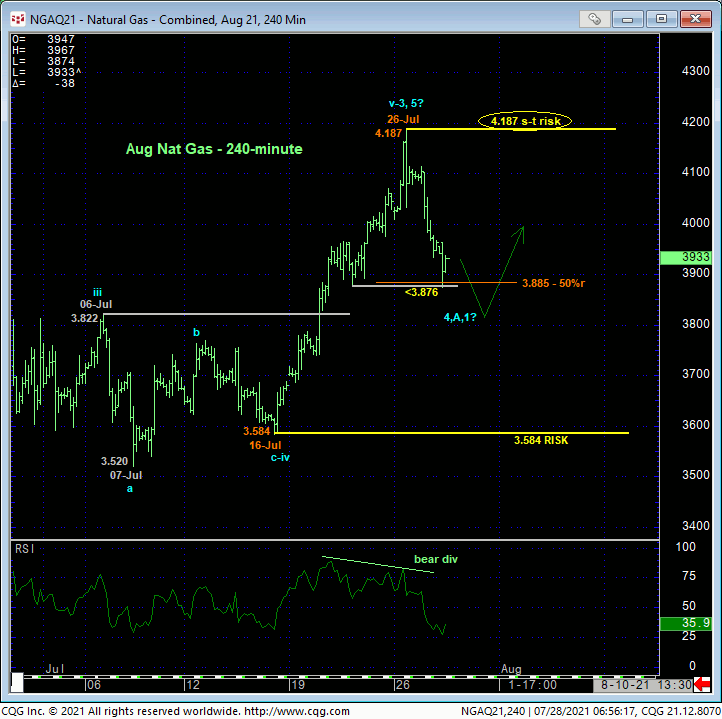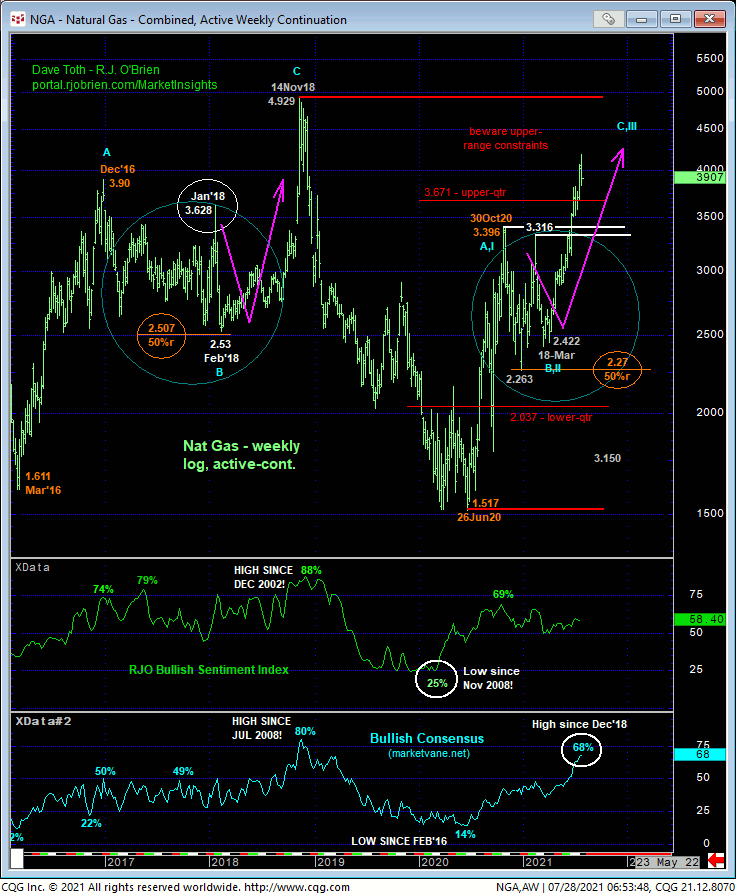
While we can only conclude at this juncture that overnight’s slip below last Wed’s 3.876 minor corrective low and our short-term risk parameter breaks the uptrend from 16-Jul’s 3.584 larger-degree corrective low and is too small a momentum failure to conclude anything more than another interim corrective dip, the bull’s reach into 4.00+ levels and the upper-quarter of its massive multi-year lateral range warrants a more conservative approach to bull risk assumption by both short- and long-term players. This week’s slip obviously defines Mon’s 4.187 high as one of developing importance and a short-term risk parameter from which non-bearish decisions like long-covers and cautious bearish punts can now be objectively based and managed. But given that this market has satisfied NONE of a three reversal requirements on a scale sufficient to even defer, let alone threaten the 13-month, 176% rally, it would be premature to conclude that 4.187 high as the end to the bull.

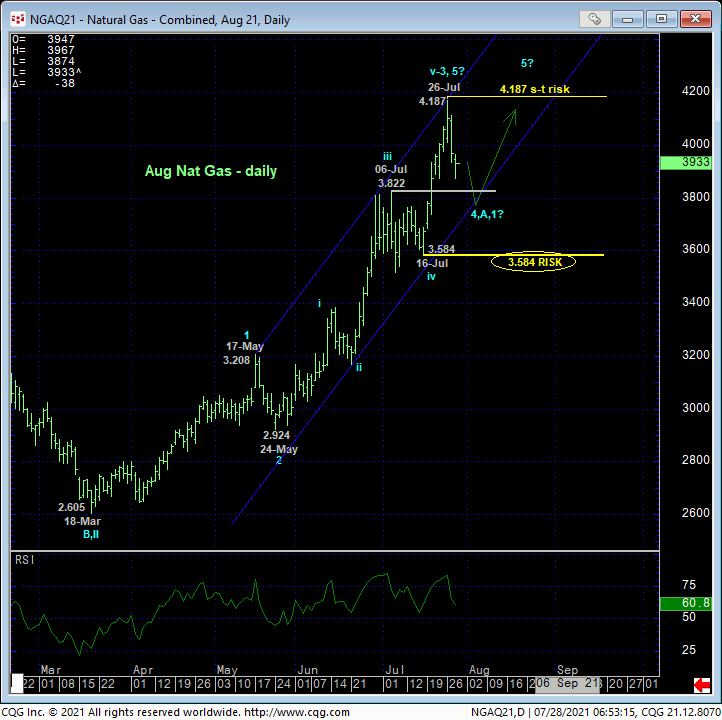
Indeed, on a scale needed to properly address the resumed major bull trend from even 18-Mar’s 2.605 low, the daily chart below shows the market still above former resistance from the 3.80-area that, since broken, now serves as a new near-term support candidate. And to truly break even the 4-month uptrend from 2.605, the market needs to confirm a bearish divergence in daily momentum below 16-Jul’s 3.584 larger-degree corrective low and key longer-term bull risk parameter. Against this longer-term bullish backdrop, longer-term players are advised to first approach this week’s setback as another corrective buying opportunity following the bullish divergence in short-term momentum needed to arrest the slide and reject/define a more reliable low and support that would then identify the risk parameter from which additional bullish exposure can be objectively based and managed.
As for the question as to whether the rally from 18-Mar’s 2.605 low is a complete 5-wave Elliott sequence or not, the answer is it’s too early to tell. Mon’s 4.187 high might have only been the end of Wave-3 of the sequence with at least one more round of (5th-Wave) highs yet to be attained. Always biasing WITH the dominant trend at the time, we believe the better bet at this juncture is for a continuation of the bull. This said, traders of all risk profiles are advised to approach a bullish policy more conservatively “up here” at 4.00+ levels as it’s now not hard to question the longer-term risk/reward metrics of a more aggressive bullish policy and exposure. Herein lies the importance of identifying risk parameters like 3.584 and 4.187 around which to base directional decisions.


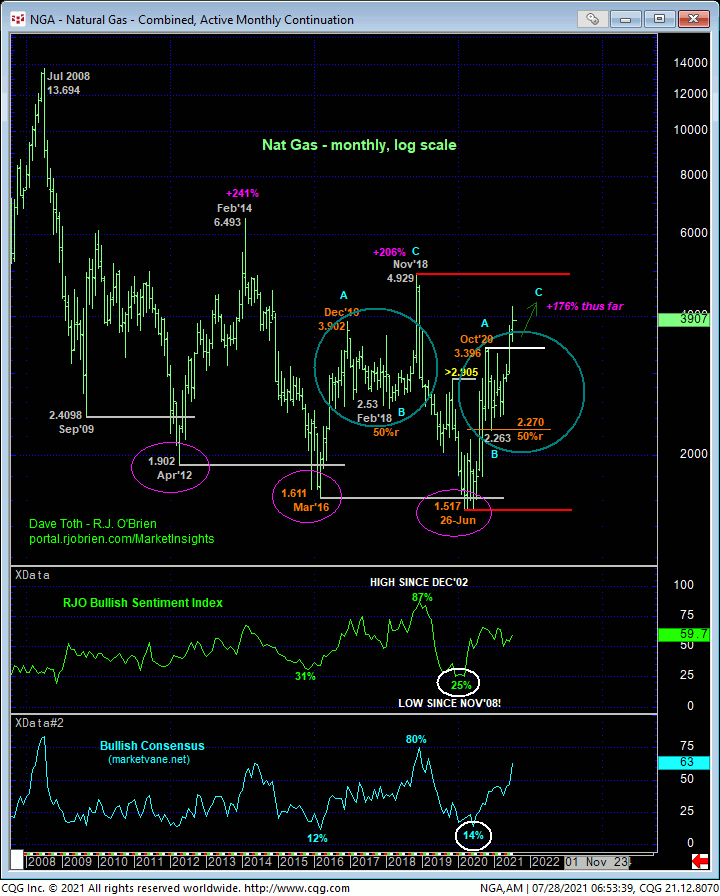
From a long-term perspective, we introduced a major base/reversal count nearly a year ago in 03Aug20’s Technical Blog and subsequent updates that warned of a multi-quarter or even multi-year 200%+ reversal to 4.000+ levels similar to that that followed Mar’16’s 1.611 low. Again, it’d be premature at this juncture to conclude this major bull’s end. But by pinging that 4.000 threshold, it would not be a stretch to suggest the better, more opportunistic stages of this 176% bull are behind it and that this market is now closer to what could be a major TOP similar to Nov’18’s blow-off end to its 32-month, 206% uptrend.
MOMENTUM is the technical tool we use to navigate ends of trends, and thus far this market has produced nowhere near the weakness required to suggest this major bull is over. This said, bulls are also advised to pare back upside expectations on new highs above levels like 4.187, where it would not surprise at all to see the beginning of the waning upside momentum that typically precedes and warns of peaking/reversal processes.
In sum, shorter-term traders have been advised to more to a neutral/sideline position as a result of overnight’s failure below 3.876, with a recovery above 4.187 negating this call and reinstating the secular bull trend. Longer-term commercial players remain advised to maintain a bullish policy and exposure with a failure below 3.584 required to negate this call, warrant its cover and prepare for a broader reversal lower. In lieu of such sub-3.584 weakness, a continuation of the secular bull to new highs above 4.187 is expected.


