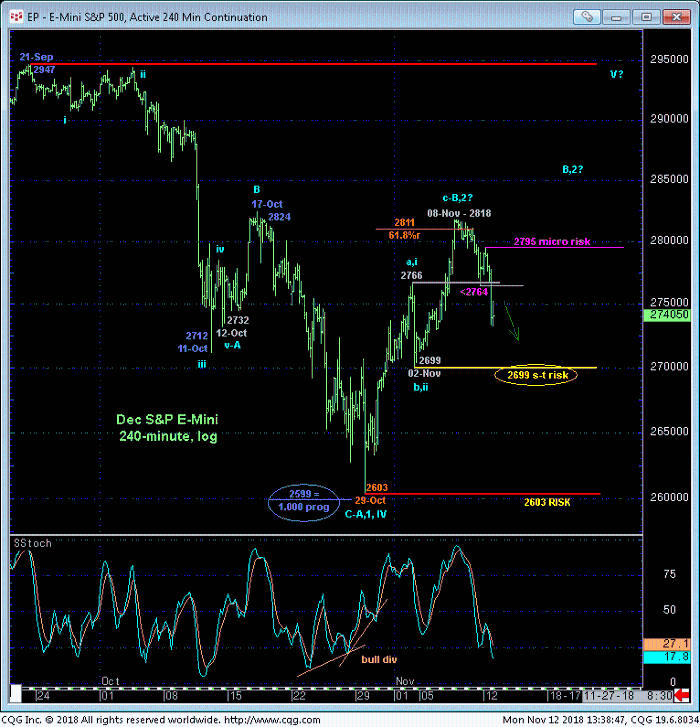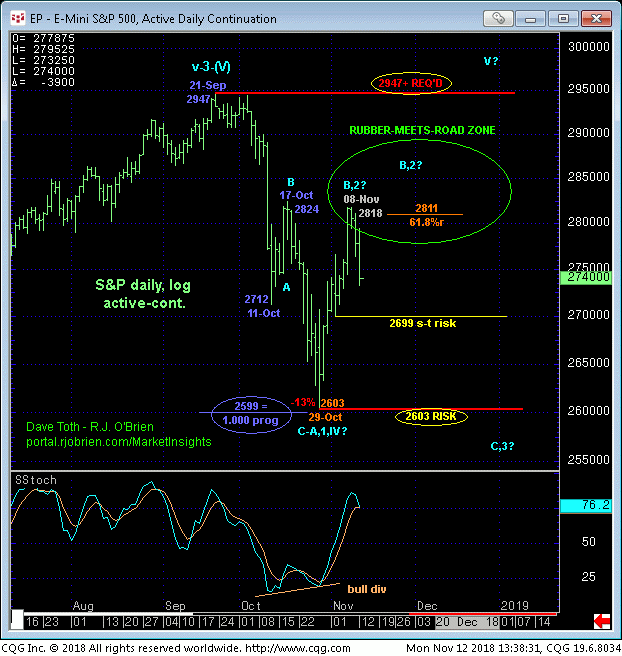
In Thur’s technical Blog we identified that day’s poke into an area (between 2811 and 2947) we warned to be watchful for either proof of continued impulsive behavior up or a rollover that could lead to potentially significant trouble down the road. We also discussed the importance of 02-Nov’s 2699 corrective low and short-term but pivotal risk parameter the market needs to sustain gains above to maintain a more immediate bullish count,
The 240-min chart below shows that while the market has yet to fail below this 2699 level, today’s break below Fri’s 2764 initial counter-trend low exposes the very, very short-term trend as down. This break leaves today’s 27795 high in its wake as the latest short-term corrective high and very tightest risk parameter the market has now go to recoup to render the past few days’ setback a 3-wave and thus corrective affair within the context of a broader bullish count. In effect, we believe the market has narrowed the range of tight but key directional triggers to 2795 and 2699.

Granted, these levels fall within the middle-half of the past couple months’ 2947 – 2603-range where the odds of aimless whipsaw risk should be considered higher. This is a difficult and challenging range-center environment from which to be making directional bets. Given the still viable prospect for a broader peak/correction/reversal threat however, those wishing to get an early leg up on further weakness given the market’s rejection thus far of our “rubber-meets-the-road zone” can do so with today’s 2795 high as the micro risk parameter to doing so. This short-term decision incurs whipsaw risk and recalls an applicable commodity trader adage of preferring to “be out, wishin you were in, then in, wishing you were out.”
The alternative to paring longs now and incurring whipsaw risk above 2795 is to wait for and require commensurately larger-degree proof of weakness below 2699 to pare or neutralize bullish exposure. This sound tack incurs greater nominal risk but less whipsaw risk. Pick your poison.

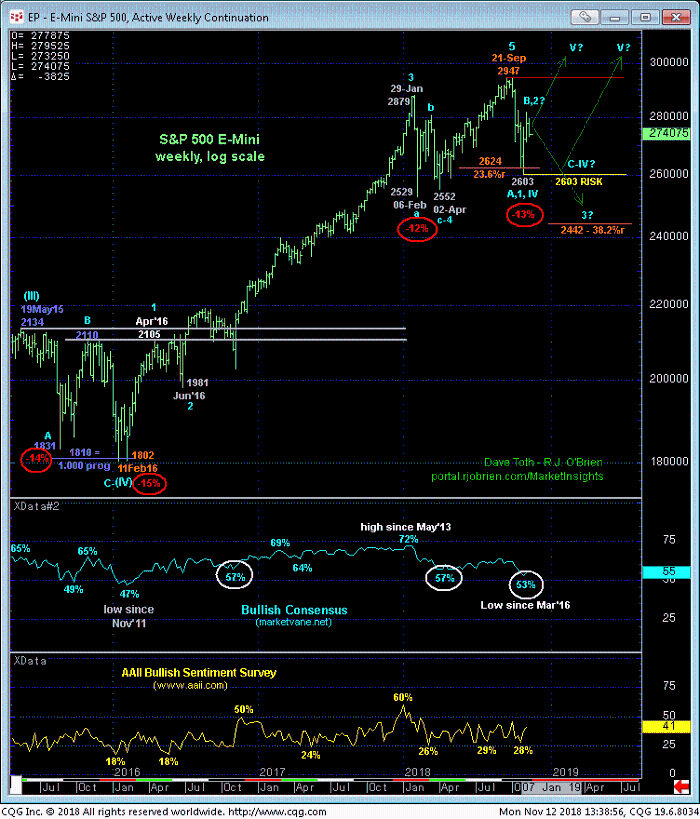
From a long-term perspective our concern remains that Sep-Oct’s 13% decline may only be the INITIAL (A- or 1st-Wave) of a much broader correction or reversal lower similar to Jan-Feb’s decline or May-Aug’15’s decline shown in the weekly log chart below. Once the bear becomes more obvious below levels like 2699 and certainly 2603, increasing numbers of bulls heading for the exits can have a dramatic downside effect.
In our last update we stipulated that if the broader bullish count was what the market has in store, it was important for the bull to sustain trendy, impulsive behavior higher from the rubber-meets-the-road zone above 2811. The past couple days’ setback is NOT that. And while the market has failed below 02-Nov’s 2699 low and short-term but key risk parameter, the technical condition is getting questionable to say the least. Per such, traders are advised to pare or neutralize bullish exposure and require proof of strength above at least 2795 to re-establish a cautious bullish position. Further weakness below 2699 raises the odds of the peak/correction/reversal count even further and potentially steep losses thereafter.


