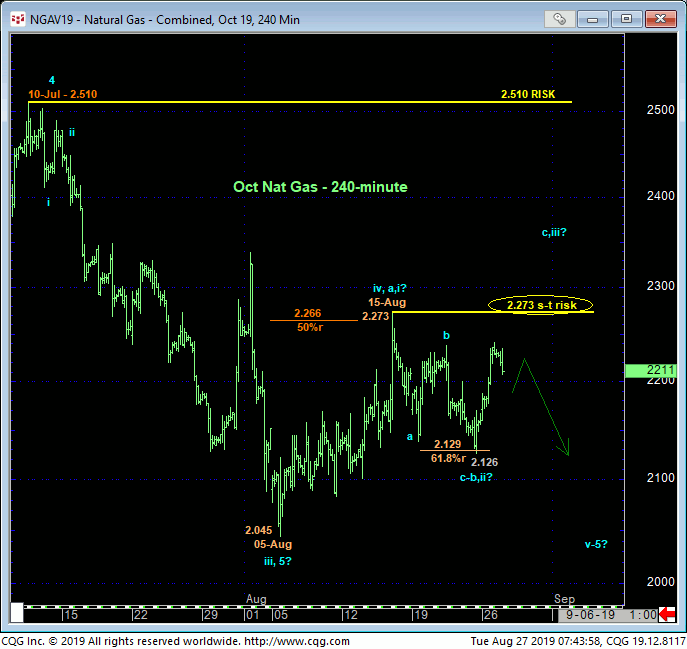
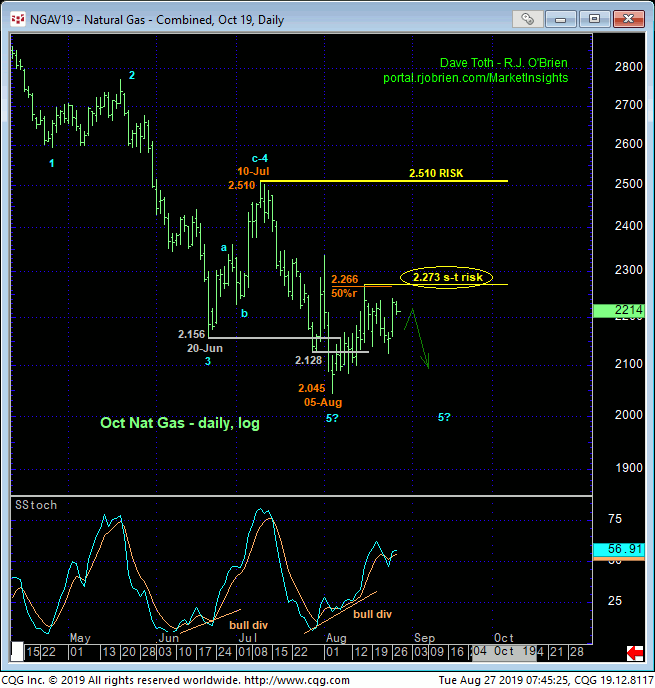
Against the backdrop of this year’s major downtrend, the market has not yet provided the evidence necessary to suggest this trend is over by recovering above either a prior corrective high or an initial counter-trend high needed to confirm a bullish divergence in momentum. But this could change quickly and potentially violently if the market can strengthen above 15-Aug’s 2.273 high in the now-prompt Oct contract detailed in the 240-min chart above and daily log chart below.
To this point early-to-mid-Aug’s recovery from 2.045 to 2.273 cannot be ignored as a 3-wave and thus corrective event still consistent with the major bear. The Fibonacci fact that this recovery came within a penny of the (2.266) 50% retrace of Jul-Aug’s 2.510 – 2.045-portion of the bear would seem to reinforce such a bear market correction count. HOWEVER, as a direct result of yesterday’s rebound, last week’s setback attempt from that 2.273 high to Fri’s 2.126 low looks to be a textbook 3-wave and thus corrective affair. Retracing 61.8% of early-Aug’s 2.045 – 2.273 rally, it’s easy to see that dip as a correction ahead of a resumption of early-Aug’s rally that could expose expanded gains if/when the market breaks above 2.273.
These issues considered and despite the relative short-term nature of that 2.273 high, that level is considered our new short-term but very important risk parameter around which traders are advised to toggles directional biases and exposure.
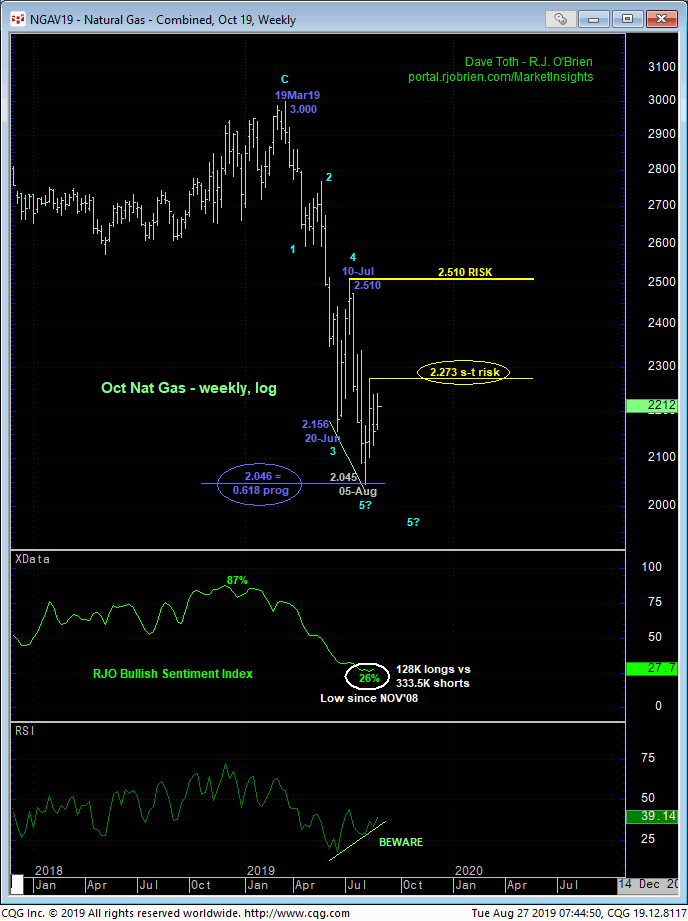
We’re placing great emphasis on an admittedly short-term risk parameter at 2.273 due to a unique and very compelling list of factors that warn of a base/reversal-threat environment that could be major in scope:
- waning downside momentum on a WEEKLY scale below amidst
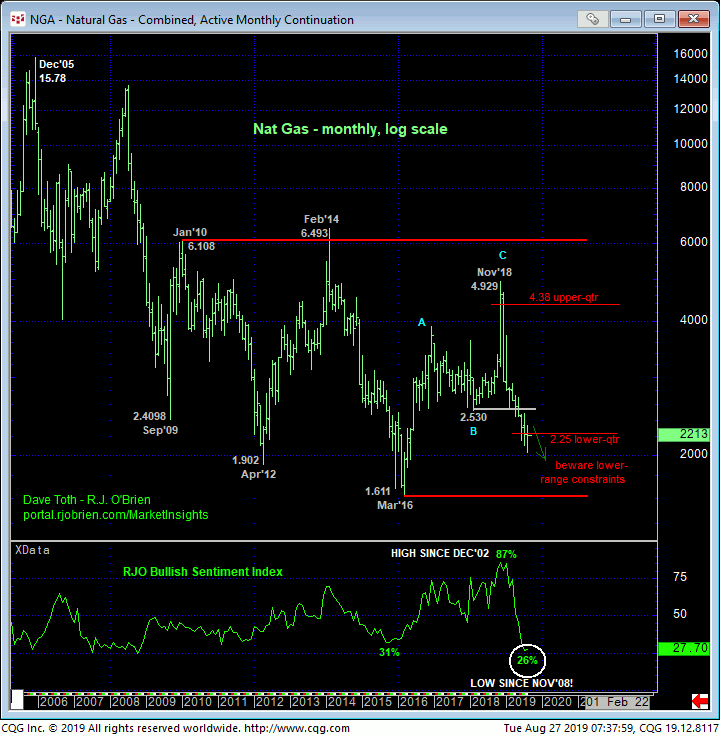
- historically bearish sentiment/contrary opinion levels not seen since Nov 2008
- the market’s engagement of the lower-quarter of the past 10-year range
- an arguably complete (textbook) 5-wave Elliott sequence down from 19’Mar’s 3.000 high where
- the suspected 5th-Wave down from 10-Jul’s 2.510 high spanned a length exactly 61.8% (i.e. 0.618 progression) of the net distance of Wave-1-thru-3 from 3.000 to 2.156.
This is an extraordinary list of factors that, reinforced with a confirmed bullish divergence in mo above an initial counter-trend high like 2.273, could expose a base/reversal environment that could be major in terms of both price and time. These issues considered, a bearish policy and exposure remain advised ahead of a resumption of the 5-month downtrend to new lows below 2.045 in the now-prompt Oct contract. A recovery above 2.273 however will threaten this count and reinforce a count calling for a base/reversal that could be major in scope, warranting a reversal from a bearish policy to a bullish one above 2.273.