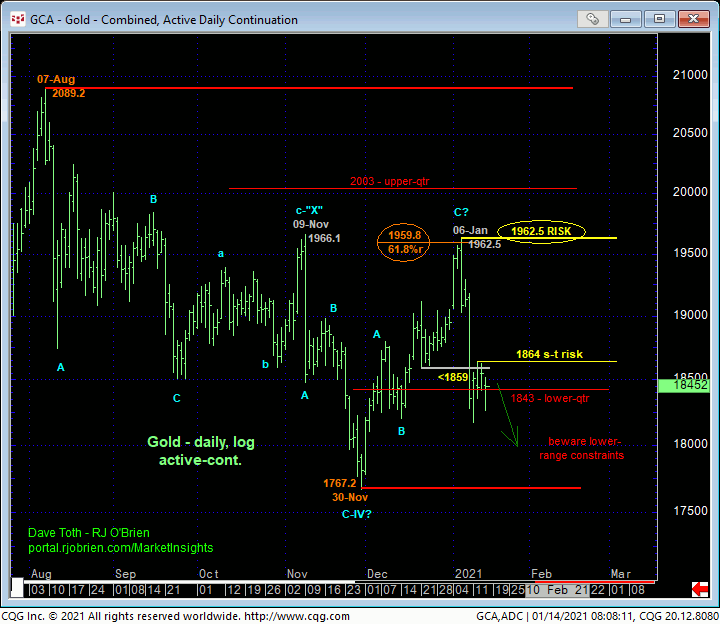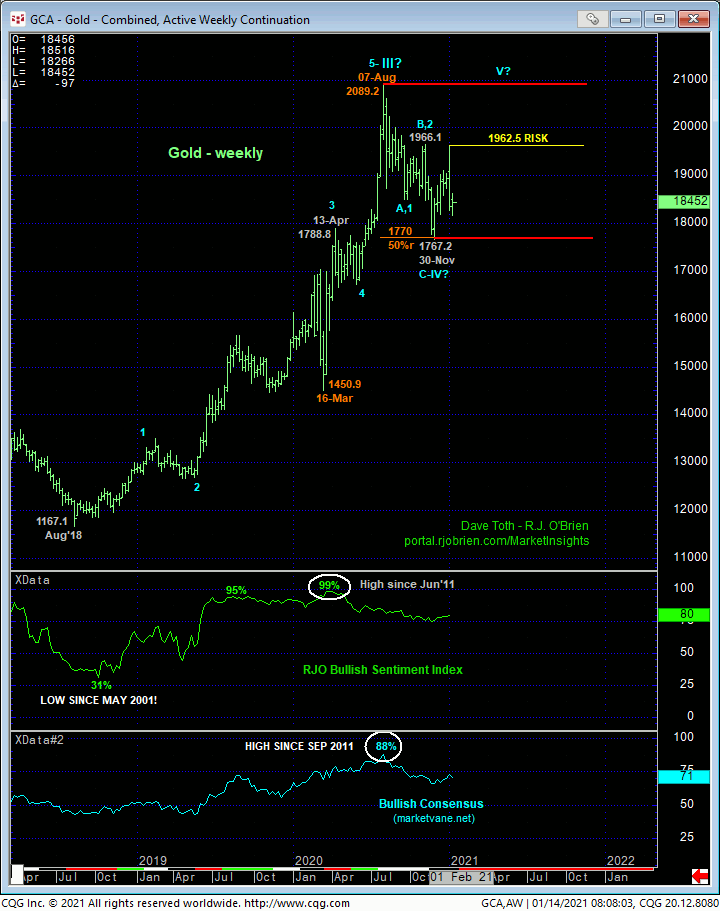
The choppiness of the past five months’ price action down from 07Aug20’s 2089.2 high shown in the daily log scale chart below is hard to look at as anything other than corrective/consolidative against the backdrop of the secular bull trend. And after last Fri’s bearish divergence in momentum following Nov-Jan’s exact 61.8% retrace of Aug-Nov’s 2089 – 1767 decline, the intra-range directional scale has certainly tipped to the bear side, leaving 06-Jan’s 1962.5 high as THE larger-degree corrective high and key risk parameter this market remains required to recoup to confirm the broader sell-off attempt as a correction ahead of the eventual resumption of the secular bull. Until and unless the market recovers above 1962.5 and especially if the market breaks 30-Nov’s 1767.2 low, there’s no way to know that this month’s relapse isn’t the dramatic 3rd-Wave f a major reversal lower.
If such a bearish count is unfolding however, then somewhere along the line the bear needs to BEHAVE LIKE ONE with trendy, impulsive behavior down below the lower-quarter of the 5-month range in general and below that 1767.2 low specifically. Per such impulsive behavior, we would NOT expect the market to be able to recover above recent corrective highs and risk parameters that would jeopardize the impulsive integrity of such a bearish count.
Conversely, if the past five months’ chop is the bull market correction we suspect it is, than the market’s proximity to the lower-quarter of this range is a prime candidate for a relapse-stemming bullish divergence in momentum needed to tilt at least the short-term directional scales higher.

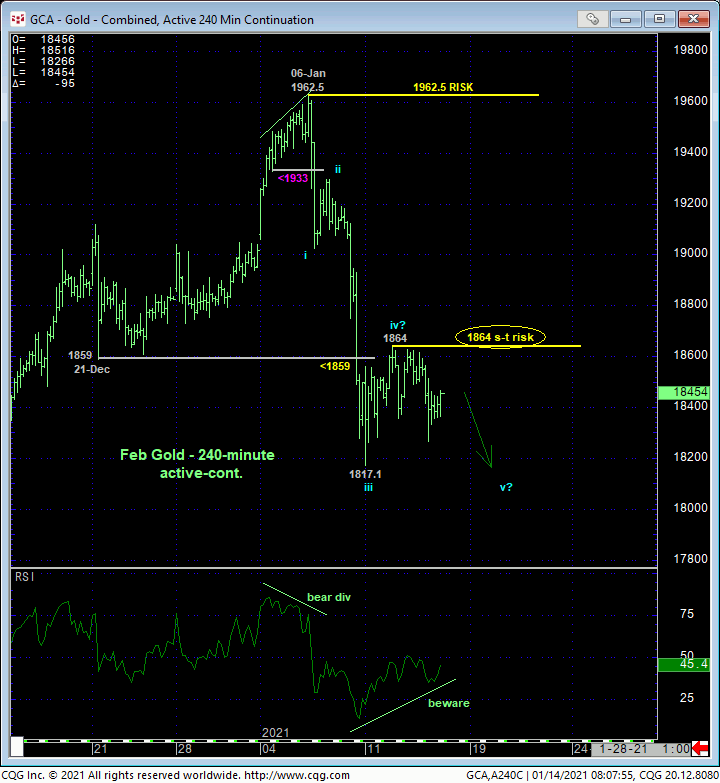
Drilling down to an intra-day 240-min chart below, yesterday’s relapse indicates Tue’s 1864 high as one of developing importance and a short-term risk parameter from which a cautious bearish policy can be objectively rebased and managed. The developing potential for a bullish divergence in momentum is clear, with a recovery above 1864 CONFIRMING this divergence and shifting the short-to-intermediate-term trend higher and presenting a favorable but cautious risk/reward opportunity from the bull side. Until such 1864+ strength is shown, further (minor 5th-Wave) losses to this early-Jan slide should not surprise.


Navigating suspected corrections while they’re unfolding is nasty, treacherous business where the best we can do is weather the choppy storm and try to identify tighter but objective risk parameters within the chop. From a longer-term perspective and while we suspect the past five months’ price action is corrective, at this juncture after the past week’s relapse we have to open to the prospect of a broader peak/reversal count. This will be confirmed on a failure below 1767.2 and negated by a recovery above 1962.5.
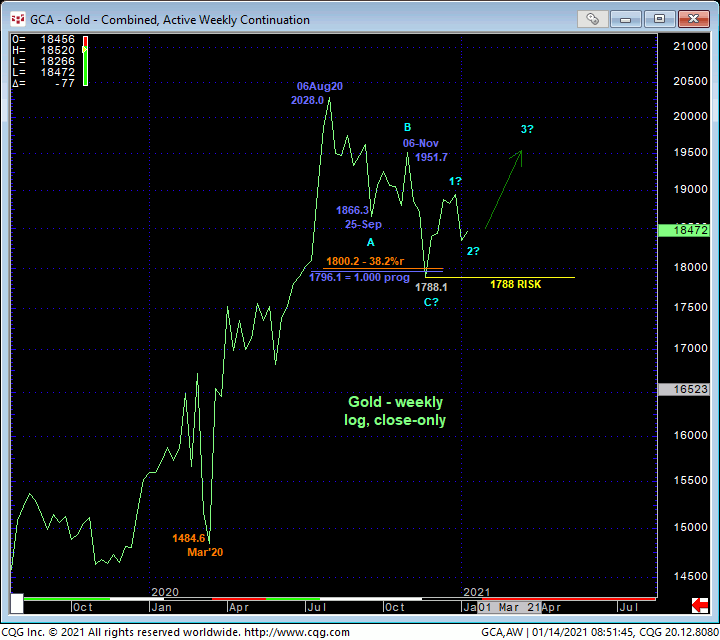
We find it noteworthy that on a weekly log close-only basis below, Aug-Nov’s sell-off attempt thus far looks to be a textbook 3-wave affair as labeled. Reinforcing this ultimately bullish count is the pair of Fibonacci retracement and progression relationships at 1800.2 and 1796.1 that the market has thus far rejected. Against this prospective bullish count, the late-Dec/early-Jan setback could be a very opportunistic 2nd-Wave corrective buy with a risk below 1788. Rather than prematurely bucking the current early-Jan sell-off however, we advise traders to wait for and require at least a relapse-stemming bullish divergence in short-term mo above 1864 before considering a bullish punt. Until and unless such 1864+ strength is proven, further losses cannot be ruled out.
These issues considered, a neutral-to-cautiously-bearish policy remains advised with a recovery above 1864 required to negate this call, warrant its immediate cover and reversal into a cautious bullish policy and exposure. A relapse below whatever low is left in the wake of such an 1864+ momentum divergence would then be required to negate that call and warrant its cover. IN effect, traders are advised to toggles directional biases and exposure around 1864.


