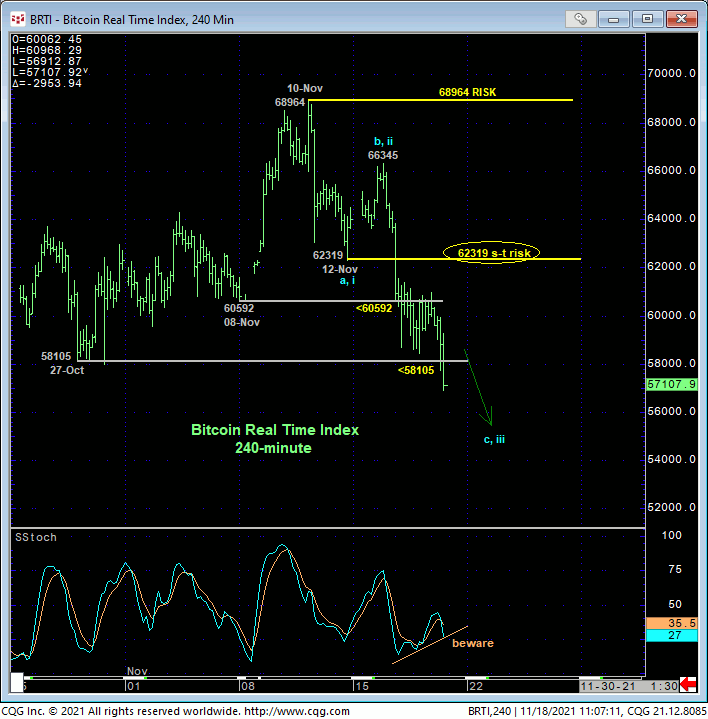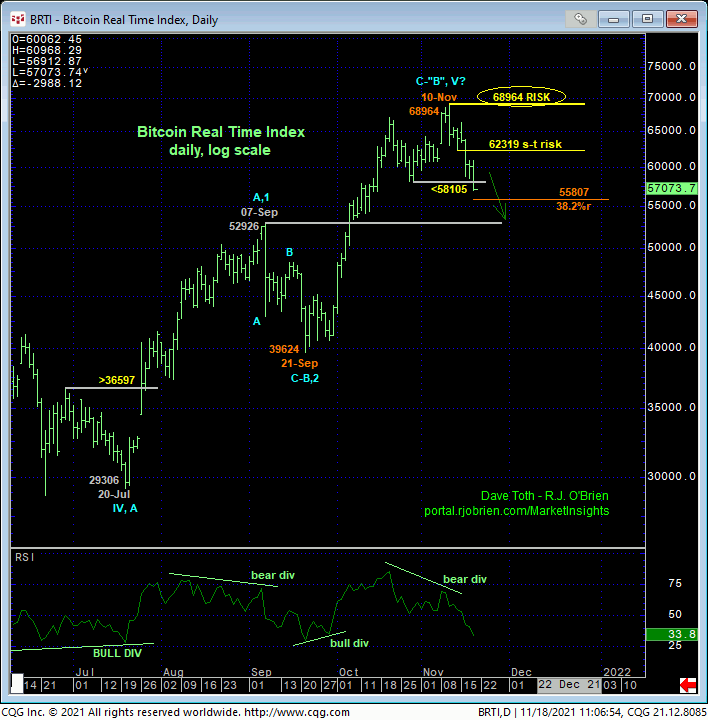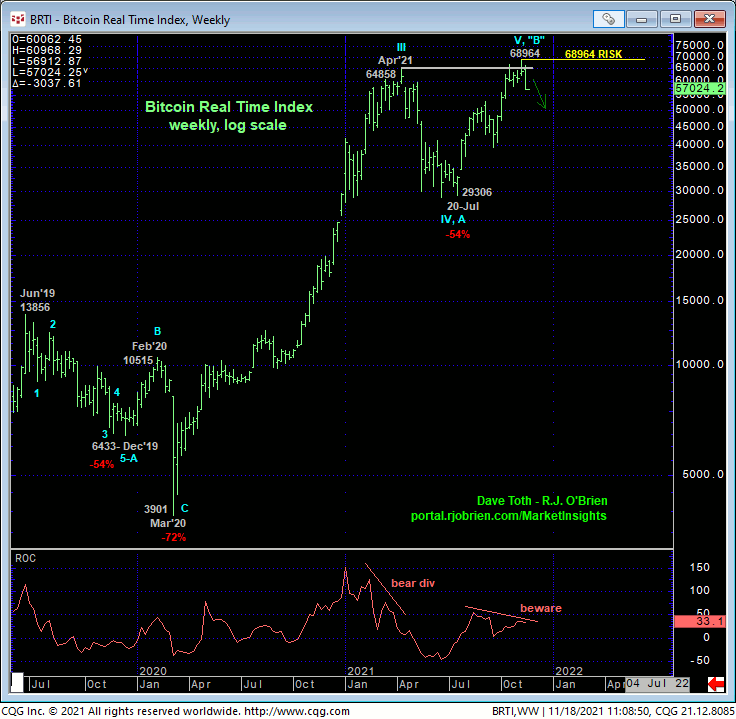
In Tue’s Technical Blog we discussed that day’s bearish divergence in short-term momentum below 08-Nov’s 60592 smaller-degree corrective low as a possible precursor to a broader peak/correction/reversal threat. Today’s continued weakness, this time below 27-Oct’s 58105 larger-degree corrective low and key risk parameter, confirms a bearish divergence in DAILY momentum that, as we’ll discuss below, defines 10-Nov’s 68964 high as one of even greater developing importance, the end of the uptrend from at least 21-Sep’s 39624 low and possibly the end of a massive 5-wave Elliott sequence that dates from Dec’18’s 3127 low.
As a direct result of this continued, larger-degree weakness, 10-Nov’s 68964 high now serves as our key long-term risk parameter the market is required to recoup to negate this broader peak/reversal threat and reinstate the secular bull trend. From a shorter-term perspective detailed in the 240-min chart below, 12-Nov’s 62319 initial counter-trend low is the minimum level this market needs to recoup to jeopardize the impulsive integrity of a more immediate bullish count and raise the odds that the sell-off attempt from 68964 is a 3-wave and thus corrective affair consistent with a still-intact secular bull market. Per such, we’re identifying 62319 as our new short-term risk parameter from which shorter-term traders with tighter risk profiles can objectively rebase and manage non-bullish decisions like long-covers and cautious bearish punts.


The daily log scale chart above shows today’s confirmed bearish divergence in momentum below 58105. This mo failure defines 10-Nov’s 68964 high as the END of the uptrend from at least 21-Sep’s 39624 low. But given the market’s gross failure to sustain Oct/Nov’s longer-term gains above Apr’s 64858 previous all-time high and resistance that was expected to hold as new support if the market was truly strong, it’s not hard to question the longer-term risk/reward merits of a continued bullish policy “up here”.
To be sure, given the magnitude of the secular bull trend, it would be premature to conclude a major top after such piddly weakness. Indeed, this market remains above the Fibonacci minimum (55807) 38.2% retrace of Sep-Nov’s rally from 39624 to 68964 as well as former 53000-area resistance-turned-support from early-Sep, keeping the recent setback well within the bounds of another mere correction within the secular bull trend. But of this is the case, then the market needs to arrest this slide with a recovery above at least our short-term risk parameter at 62319 and preferably recoup 10-Nov’s obviously pivotal 68964 high. Until and unless such strength is resurrected, the extent to which this market might be vulnerable to lower prices is indeterminable and potentially extreme. Trendy, accelerated losses below the 52000-handle-area would reinforce a broader peak/reversal count that would then warn of protracted losses in the months and even quarters ahead.

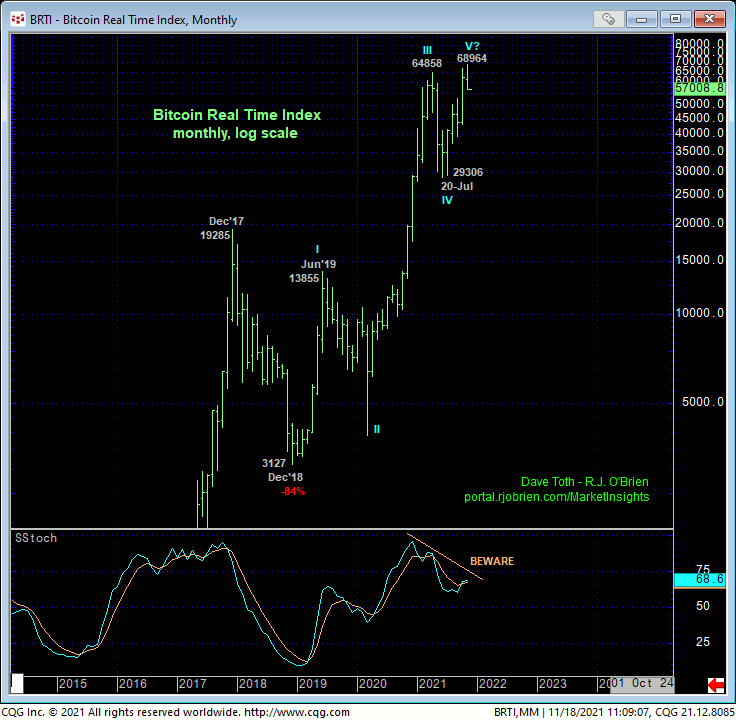
Finally, the monthly log scale chart below shows the secular bull trend and potentially complete 5-wave Elliott sequence from Dec’18’s 3127 low. The commensurately larger-degree weakness below Jul’s 29306 major corrective low required to confirm such a bearish count is grossly impractical to be of any use whatsoever. But such a count is important to keep in the back of one’s mind relative to current and more practical evidence of weakness like that that has been confirmed over the past week or so where, in effect, we’re acknowledging and accepting whipsaw risk back above 68964 in exchange for much deeper nominal risk below even 21-Sep’s 39624 low, let alone 20-Jul’s 29306 low.
These issues considered, a cautiously bearish policy is advised for shorter-term traders with a recovery above 62319 required to defer or threaten this call enough to warrant moving to a neutral/sideline position. Longer-term institutional traders and investors are advised to move to a neutral/sideline position to circumvent the depths/risk/cost unknown of a larger-degree correction or major reversal lower with a recovery above 68964 required to negate this call, reinstate the secular bull and warrant a return to a bullish tack. In lieu of a recovery above at least 62319 and preferably 68964, further and possibly steep, protracted losses should not surprise.


