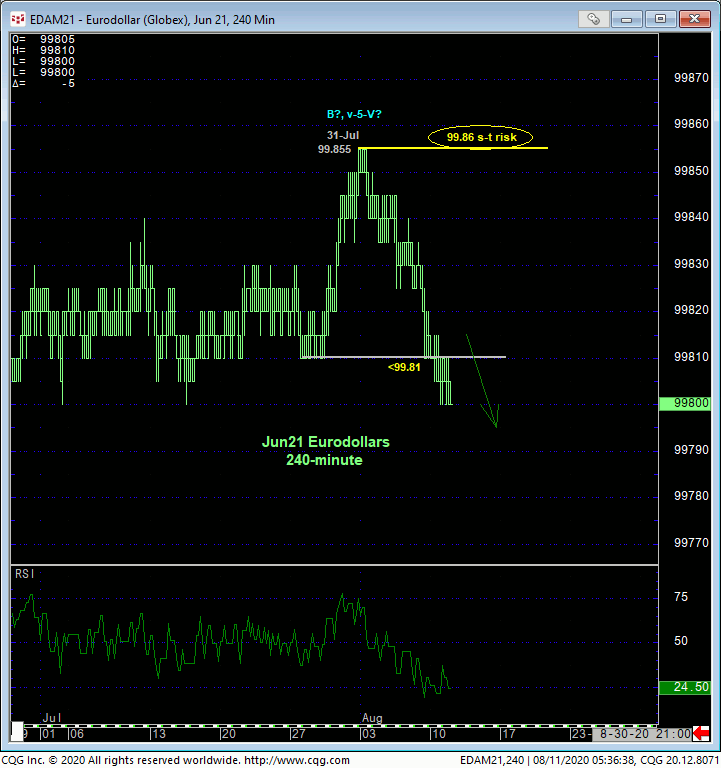
The 240-min chart below shows yesterday’s break below a 99.81 very minor corrective low from 28- and 29-Jul. No great shakes, right? This market has been stuck in a 5-bp cocoon for the past month-and-a-half and in basically a 13-bp range fr the past three months. On the smallest of scales however, and certainly not of a scale that we can conclude any longer-term forecasts, this nondescript sub-99.81 failure defines 31-Jul’s 99.855 high as one of developing importance and an objective risk parameter from which non-bullish decisions like long-covers and bearish punts can now be objectively based and managed. This is a 6-bp risk parameter for ANY amount of downside potential the market has in store for us. And per some of the longer-term factors discussed below, this could present one of the great risk/reward opportunities we’ve seen for a while.


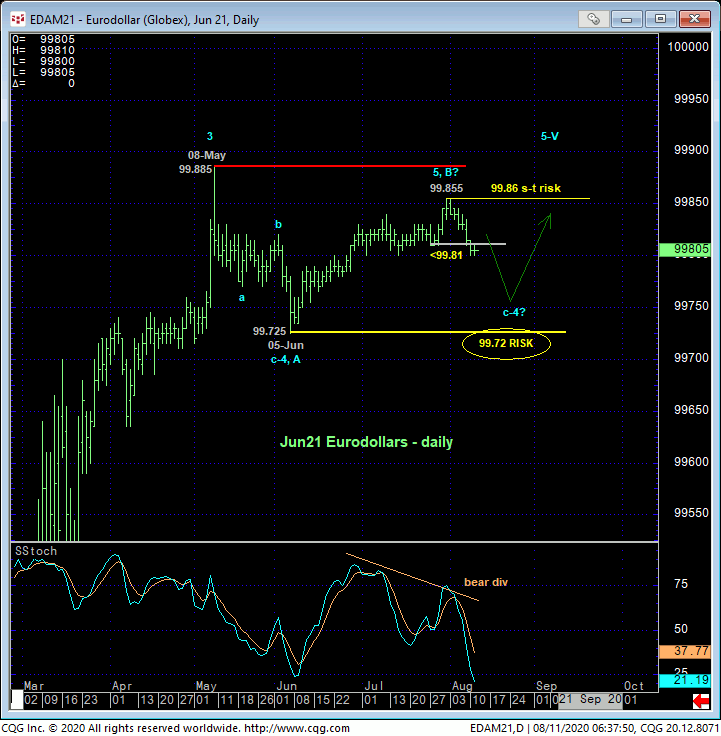
On a daily high-low basis above, yesterday’s bearish divergence in momentum below 99.81 confirms last week’s 99.855 high as THE END of the uptrend from 05-Jun’s 98.725 low. This is a technical fact that defines that 99.855 high as a very objective risk parameter the market now needs to recoup to mitigate any peak/correction/reversal count and reinstate the secular bull. But on this bar chart basis, the market remains well within the bounds of a prospect lateral bull-flag (4th-Wave) correction/consolidation from 08-May’s 99.885 high that warns of an eventual resumption of the secular bull trend that preceded it.
Such a secular bull market resumption would surprise NO ONE under the current perceived “zero interest rate” environment. But as is always the case, the “bond vigilantes”- as they used to be called back in the ’80s but are really just the collective world’s assessment and BET on market direction- might have other plans.
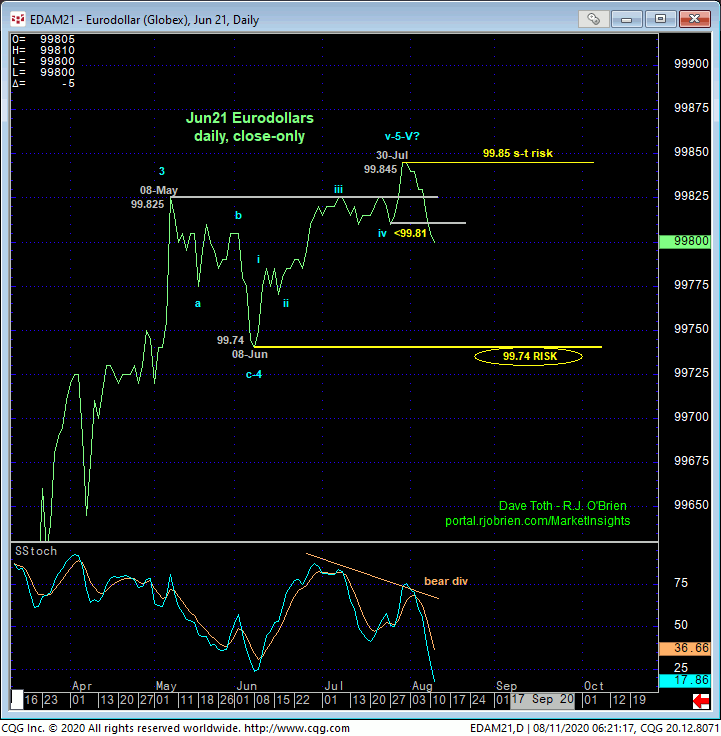
If we look at a daily close-only chart below, not only is the rally from 08-Jun’s 99.74 low a textbook 5-wave Elliott sequence, this rally broke 08-May’s 99.825 high, resuming the secular bull market. By thus far failing to sustain those gains, we must acknowledge the prospect that Jun-Jul’s rally is the completing 5th-Wave of an Elliott sequence that dates from Nov’19’s 98.335 low. If correct, we could be witnessing the embryonic stage of a peak/reversal environment that would be absolutely massive in scope, shocking the world (down the road, because NOBODY would be expecting this).

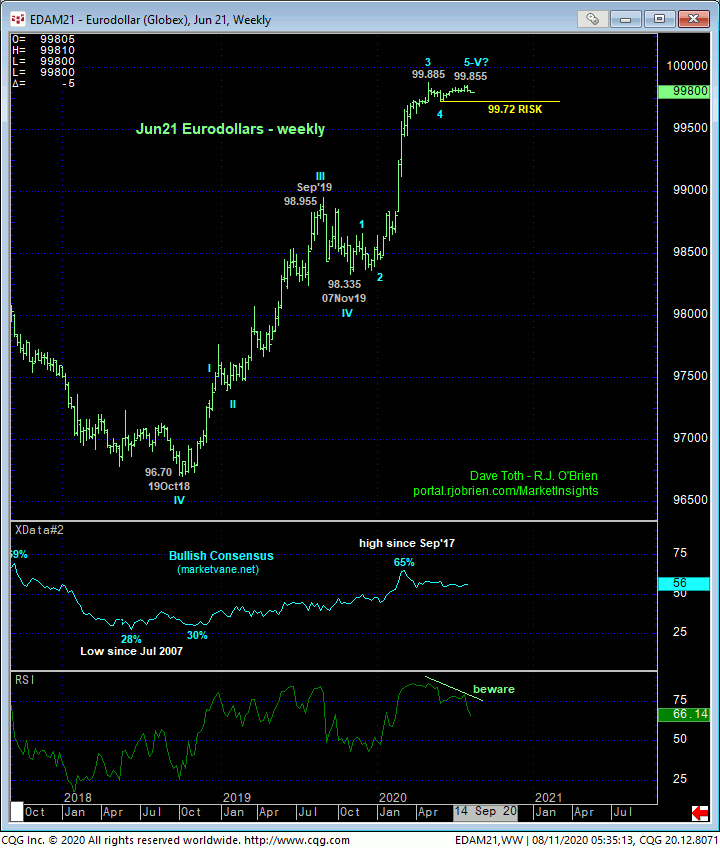
The weekly chart below shows the resumption of a nearly 2-YEAR secular bull market from 07Nov19’s 98.335 low where, frankly, it’s easy to see a prospectively compete 5-wave Elliott sequence as labeled. Even more startling is the prospect that this 98.335 – 99.855 move is the completing 5th-Wave of the secular sequence from Oct’18’s 96.70 low.
Of course, we cannot conclude a major peak/reversal from just piddly smaller-degree weakness. The RSI measure of momentum shows upside momentum waning over the past three months, but this divergence will not be considered CONFIRMED to the point of major bearish action until the market fails below 05-Jun’s 99.725 larger-degree corrective low and key long-term risk parameter. Such a commensurately larger-degree momentum failure remains required to, in fact, break the uptrend from Nov’19’s 98.335 low, let alone the 2-year bull. In effect then, the market has identified 99.86 and 99.72 as the key directional triggers heading forward. Technical and trading SCALE is an obvious element a this point with shorter-term traders advised to move to a cautiously bearish policy with a recovery above 99.86 required to negate this call and warrant its cover. Longer-term players remain OK to maintain a bullish policy until the market fails below 99.72 and/or pare bullish exposure to a more conservative level due to the peak/correction/reversal-threat factors introduced above. But until and unless this market recovers above 99.86, we would not be surprised to be LOOKING UP at current levels from possibly dozens of basis points lower over the next six months or so. Oct’18’s MAJOR base/reversal started in a similarly subtle manner.


