Posted on Nov 29, 2023, 09:21 by Dave Toth
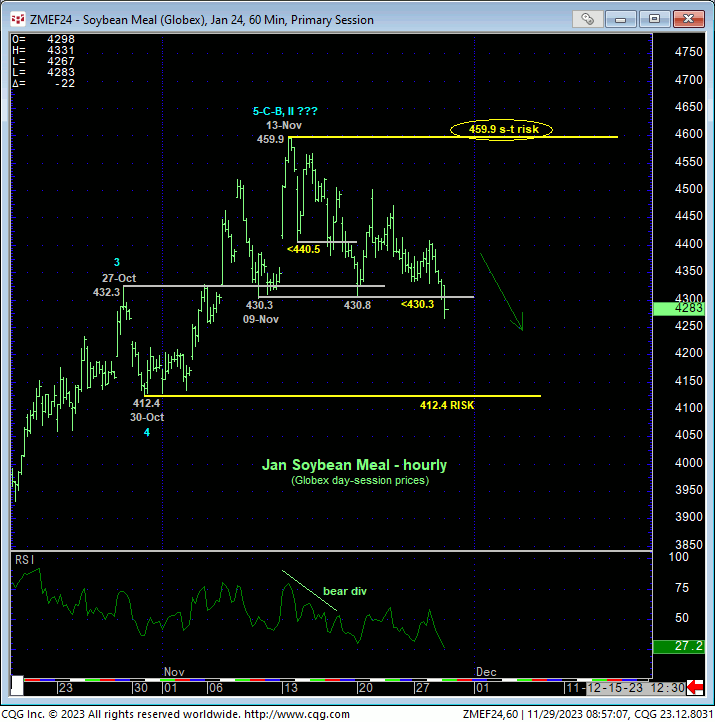
In 21-Nov’s Technical Blog we identified 09-Nov’s 430.3 corrective low as the latest smaller-degree corrective low and short-term risk parameter the market needed to sustain gains above to maintain a more immediate bullish count and risk/reward metrics of bullish exposure for shorter-term traders. Today’s failure below this level confirms a bearish divergence in daily momentum and defines 13-Nov’s 459.9 Globex day-session high as one of obvious developing importance and very possibly the END of the impressive rally from 05-Oct’s 366.2 low. Per such, we’re defining 459.9 as our new short-term parameter from which both short- and longer-term traders can objectively base non-bullish decisions like long-covers and cautious bearish punts.


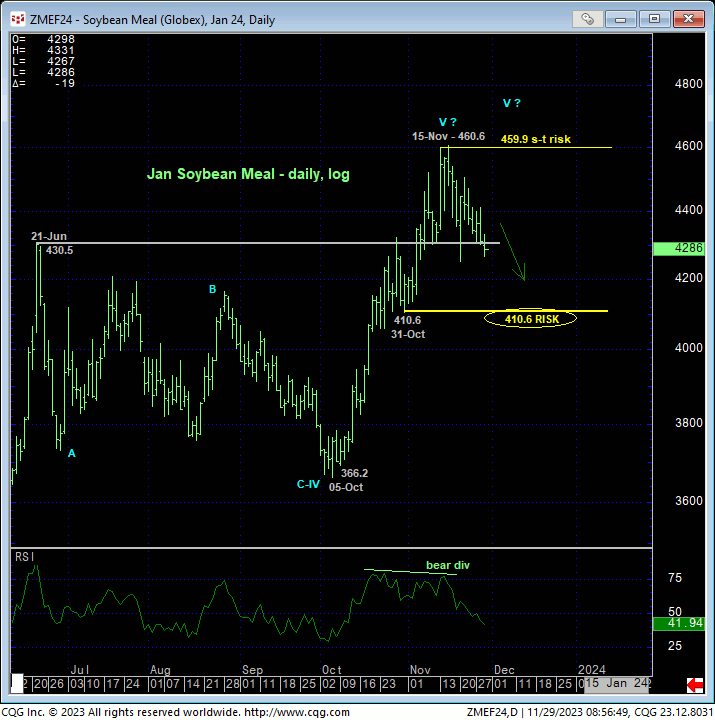
The daily log scale chart above shows not only today’s bearish divergence in momentum, but also the market’s failure thus far to sustain early-Nov’s breakout above the key 430-area that has provided resistance since last Mar and SHOULD have held as new support per any broader bullish count. Given the magnitude of Oct-Nov’s rally, it would be premature to conclude a major top at this juncture. Indeed, the past couple weeks’ setback still falls within the bounds of a correction within a broader move higher. Commensurately larger-degree weakness below 31-Oct’s 410.6 larger-degree corrective low and key longer-term bull risk parameter remains required to, in fact, break Oct-Nov’s uptrend and resurrect what we still believe is a major, multi-quarter PEAK/reversal process from Feb’s 508 high on an active-continuation basis. BUT IF the past couple weeks’ setback is “just” a correction, then it’s now incumbent on the bull to BEHAVE LIKE ONE by not only arresting this relapse almost immediately, but also sustaining trendy impulsive behavior higher and blowing away 13-Nov’s 459.9 high. Until and unless these conditions are met, the extent to which the Managed Money community has its neck sticking out on the bull side is once again fuel for considerable downside vulnerability.
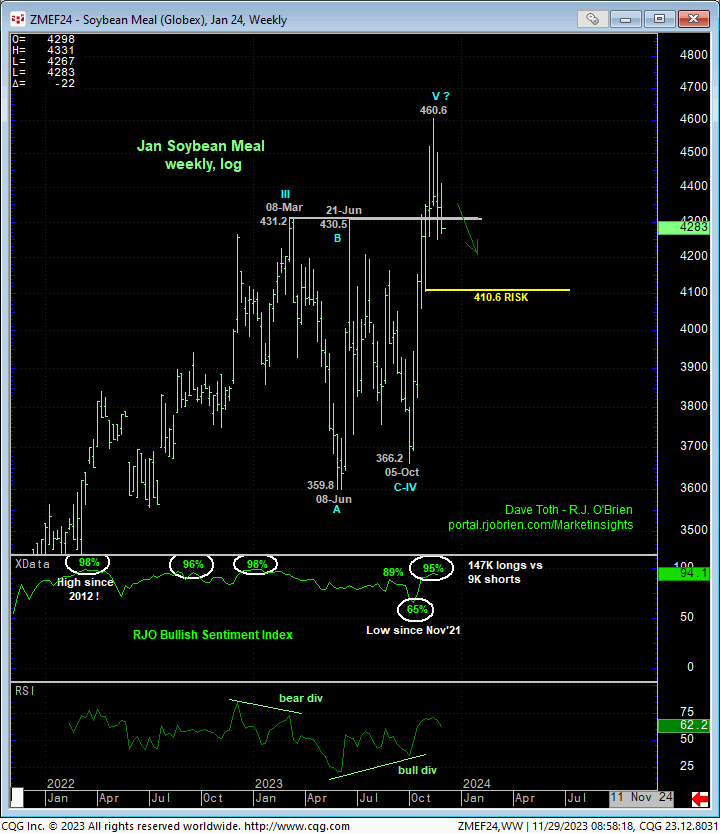
The weekly log scale chart of the Jan contract shows our RJO Bullish Sentiment Index at a recent 95% reading, with the current 94% level reflecting a whopping 147K Managed Money long positions reportable to the CFTC versus only 9K shorts. Such a bullish skew has resulted in many steep reversals in this market over the years.

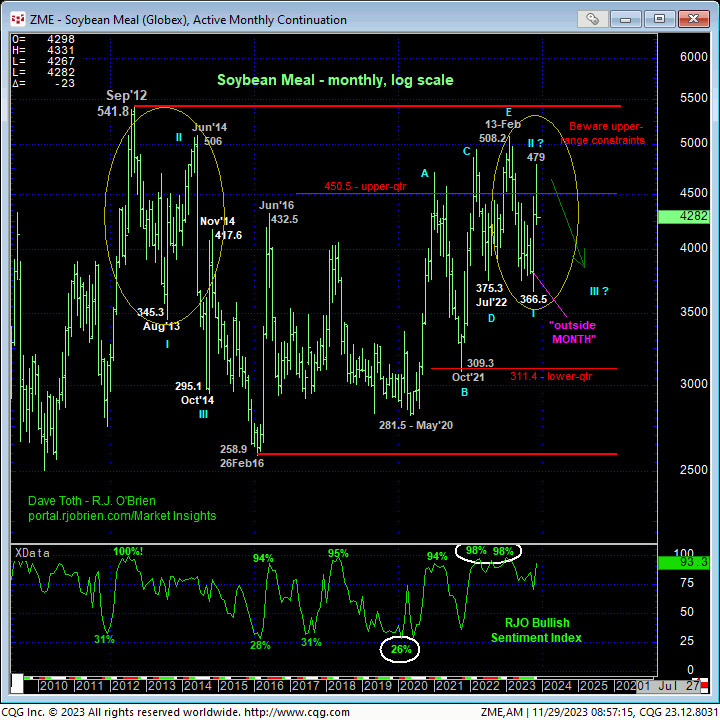
Lastly, on an active-continuation basis, the monthly log chart below shows:
- the market’s recent engagement and another rejection of the upper-quarter of its massive but lateral historical range
- a bearish divergence in monthly momentum from Jun, and
- historically frothy sentiment/contrary opinion levels.
These technical facts question the longer-term risk/reward merits of a continued bullish policy and exposure “up here”.
These issues considered, a cautious bullish policy remains arguably intact for longer-term commercial players until/unless negated by commensurately larger-degree weakness below 31-Oct’s 410.6 larger-
degree corrective low. For most other short-to-intermediate-term traders however, we have advised moving to at least a neutral/sideline position as a result of today’s failure below 430.3. A cautious bearish position would also be advised with a recovery above 459.9 required to negate this specific call and warrant its cover.


