Posted on Sep 25, 2023, 07:58 by Dave Toth
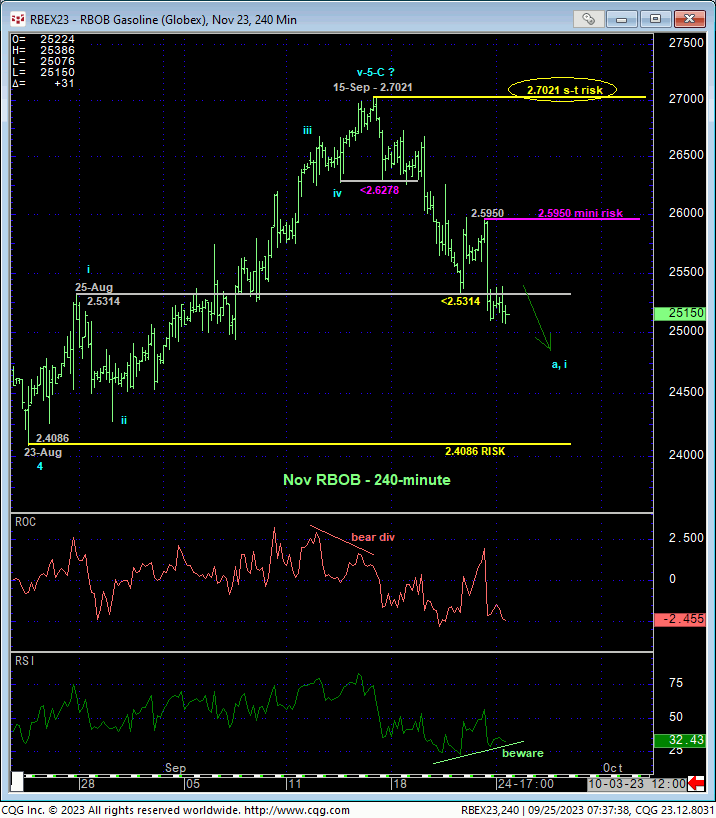
In 18-Sep’s Technical Webcast we discussed 15-Sep’s bearish divergence in very short-term momentum as an early warning that 15-Sep’s 2.7021 high might have completed a 5-wave Elliott sequence up from 23-Aug’s 2.4086 low but that further “larger-degree” proof of weakness remained required to reinforce this call. Fri’s continued erosion, this time below our short-term bull risk parameter defined by 25-Aug’s 2.5314 1st-Wave high detailed in the 240-min chart below, confirms this next higher level of weakness that is sufficient to conclude 15-Sep’s 2.7021 high as THE END of the sequence up from 23-Aug’s 2.4086 major corrective low.
As a result of Fri and today’s continued weakness, 15-Sep’s 2.7021 high is one of obvious developing importance and THE level this market now needs to recoup to mitigate a broader peak/reversal threat and reinstate the 5-monthg rally. In lieu of such resumed strength, a broader peak/reversal count cannot be ignored. Per such, 2.7021 is considered our new short-term but key parameter from which non-bullish decisions like long-covers and cautious bearish punts can be objectively based and managed.
Knowing that peak/reversal processes typically include some kind of (b- or 2nd-wave or right-shoulder) corrective rebuttal to the initial (a- or 1st-wave) counter-trend decline, we’re defining Fri’s 2.5950 high as the latest smaller-degree corrective high the market now needs to sustain losses below to maintain a more immediate bearish count. Its failure to do so will confirm a countering bullish divergence in short-term momentum and expose at least this not unexpected corrective rebound or a resumption of the 5-month uptrend. Per such, Fri’s 2.5950 high is considered our new mini parameter from which short-term traders with tighter risk profiles can objectively rebase and manage the risk of non-bullish decisions like long-covers and bearish punts.
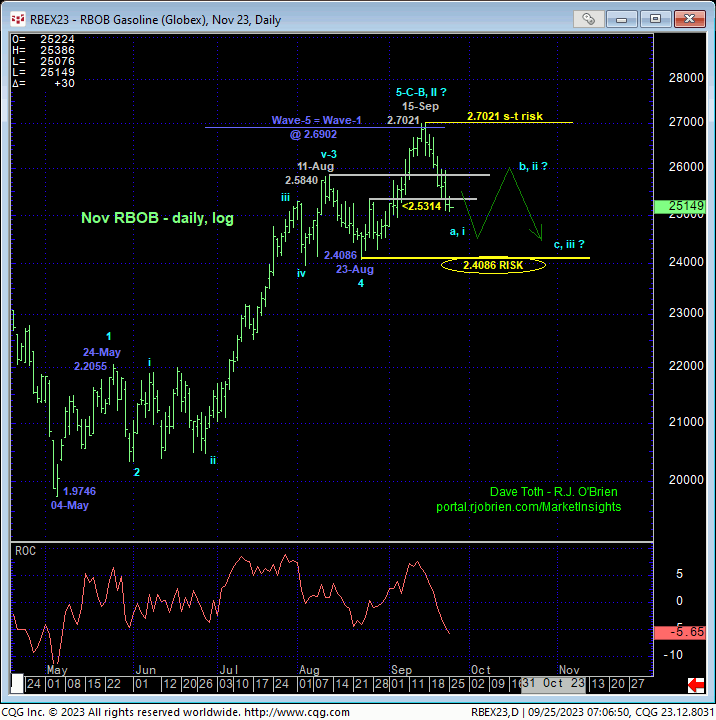
From a longer-term perspective, commensurately larger-degree weakness below 23-Aug’s 2.4086 larger-degree corrective low shown in the daily log chart above remains required to confirm a bearish divergence in weekly momentum and define 15-Sep’s 2.7021 high as THE END of what appears to be a textbook 5-wave Elliott sequence up from 04-May’s 1.9746 low. Clearly failing to sustain Sep gains above Aug’s highs and former resistance-turned-support is ancillary evidence of a developing top as is the Fibonacci fact that the suspected 5th-Wave of this sequence up from 23-Aug’s 2.4086 low came within a bit more than a penny of equaling (i.e. 1.000 progression of) May’s 1st-Wave rally from 1.9746 to 2.2055 since the 3rd-Wave “extended”.
While a larger-degree momentum failure below 23-Aug’s larger-degree corrective lows at 2.4086 (2.4547 close) will confirm the peak/reversal, we will be watchful for the requisite proof of trendy, impulsive 5-wave behavior on this suspected initial counter-trend decline and, most importantly, proof of 3-wave corrective behavior on a prospective rebuttal to this decline to further reinforce the peak/reversal process and possibly provide a more practical longer-term bull risk parameter than 2.4086 for longer-term commercial players.
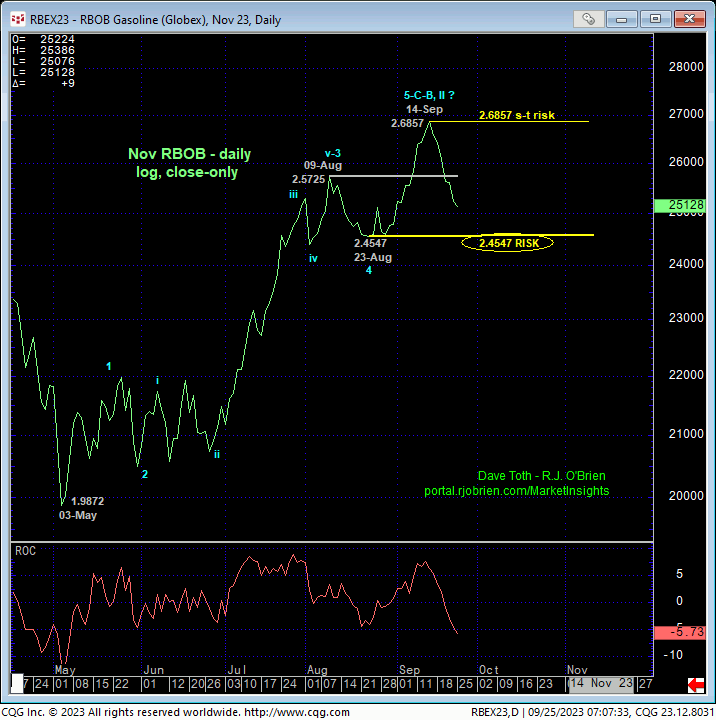
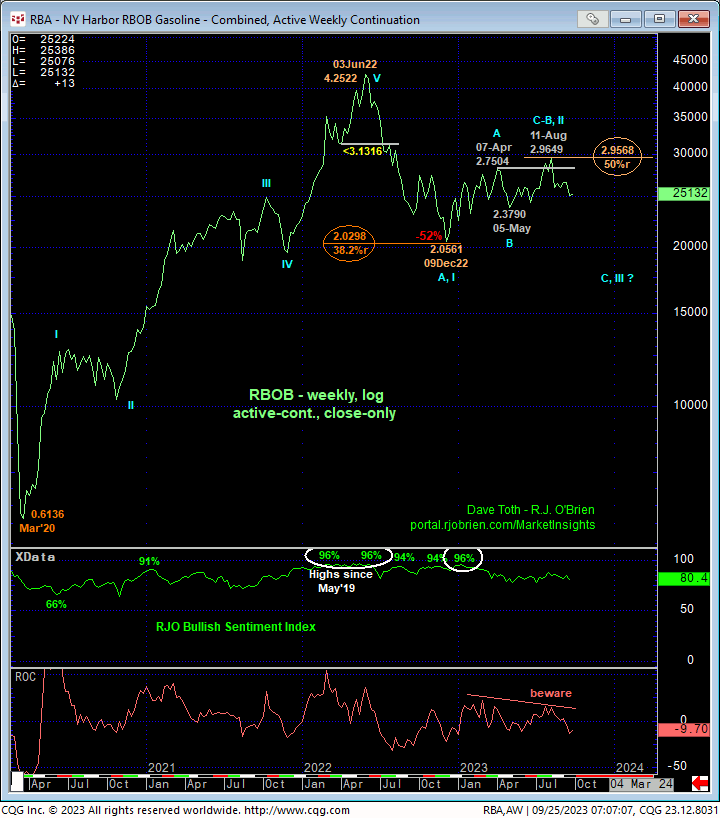
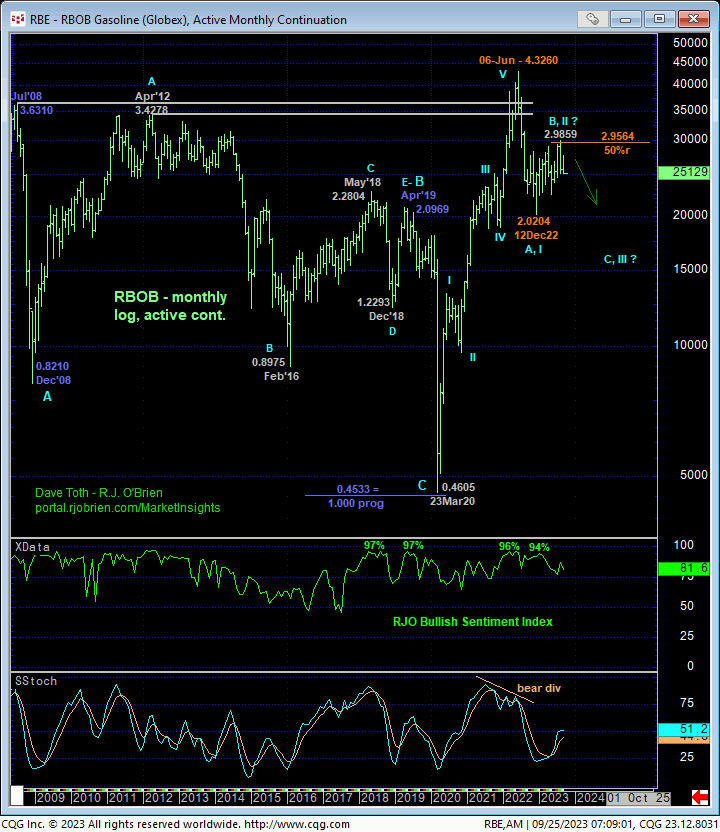
From an even longer-term perspective, the extraordinarily labored recovery attempt from last Dec’s lows on a weekly log close-only basis above and a monthly log basis below of the most active futures contract is characteristic of a mere B- or 2nd-Wave corrective rebuttal to Jun-Dec22’s INITIAL A- or 1st-Wave decline within a still-arguable and massive, multi-quarter peak/reversal threat that warns of an eventual resumption of last year downtrend to eventual new lows below 2.02. Might the resumption of such a major bear trend be in its infancy from 15-Sep’s 2.7021 high??? Yep, it certainly might. But as you know, we cannot conclude long-term counts from proof of only shorter-term weakness. And herein lies the importance of 1) the market’s ability to now sustained losses below 2.7021, 2) further weakness below 2.4086 and, 3) sustained trendy, impulsive behavior to the downside thereafter.
These issues considered, shorter-term traders have been advised or remain advised to move to at least a neutral/sideline if not cautiously bearish position with strength above 2.5950 and/or 2.7021 required to threaten and then negate this call and warrant defensive measure. Longer-term commercial players are advised to pare bullish exposure to more conservative levels and jettison remaining exposure on the immediate break below 2.4086 that will confirm the reversal and expose indeterminable losses thereafter. In the meantime, we will be watchful for proof of 3-wave corrective behavior on recovery attempts to reinforce this bearish count and provide preferred risk/reward selling opportunities.
