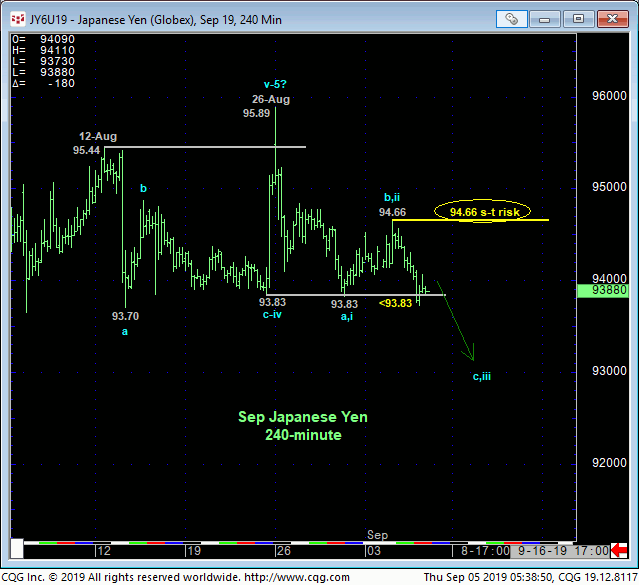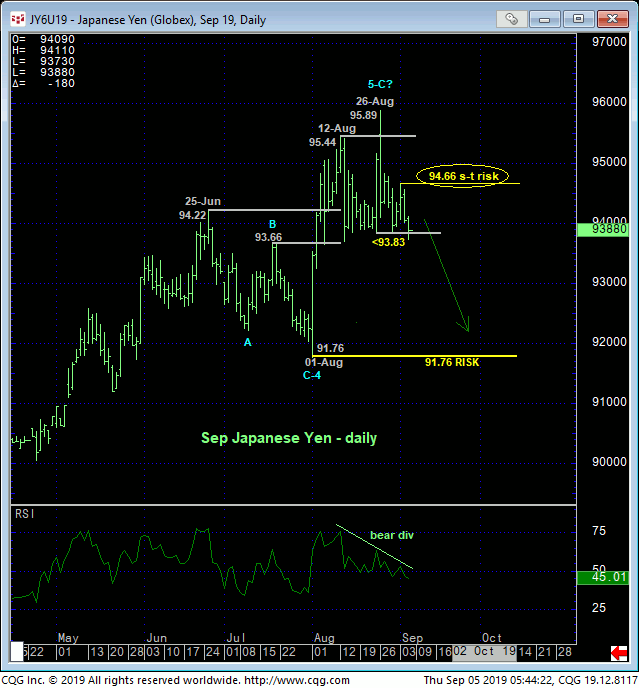
Overnight’s break below the past week-and-a-half’s 93.83 lows, support and short-term risk parameter confirms a bearish divergence in momentum that, along with a number of other factors, warn of a peak/reversal-threat environment that we believe could be major in scope. From a shorter-term perspective this weakness leaves Tue’s 94.66 high in its wake as the latest smaller-degree corrective high that this market is minimally required to recover above to defer or threaten this bearish count. Per such this 94.66 level is considered our new short-term risk parameter from which a newly advised bearish policy and exposure can be objectively based and managed.


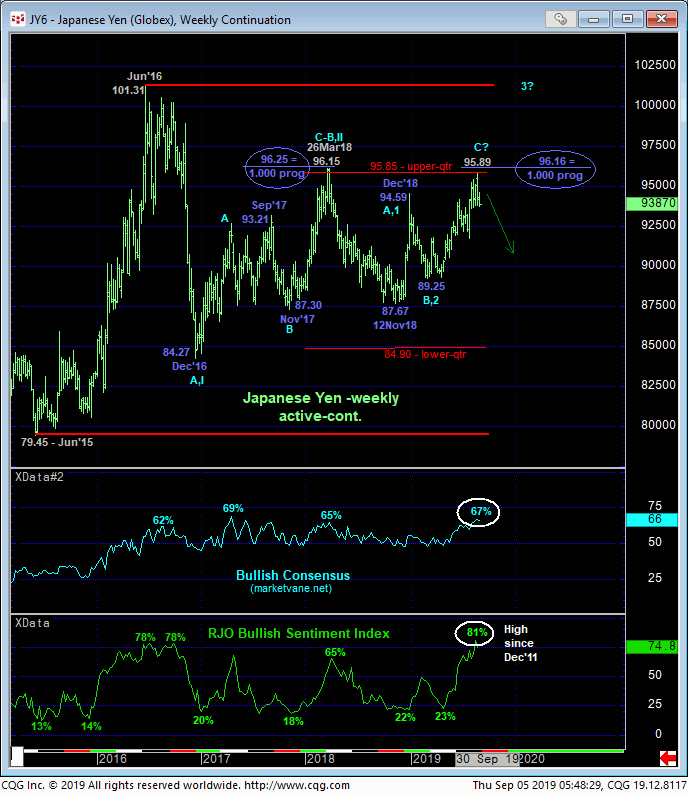
The daily chart above shows the confirmed bearish divergence in momentum that breaks at east the uptrend from 01-Aug’s 91.76 low. But the prospect that Aug’s 91.76 – 95.89 rally is the completing 5th-Wave to an Elliott sequence from early-Mar’s 89.25 low contributes to a major peak/reversal environment. This Elliott count is reinforced by the Fibonacci fact that the (suspected C-Wave) rally from 89.25 was only 25-pips from the (96.16) 1.000 progression relationship to Nov-Dec’18’s 87.67 – 94.59 (suspected A-Wave) rally that preceded it. Such a C-Wave = A-Wave 1.000 progression relationship is also evident in the Dec’16-to-Mar’18 3-wave recovery as well.
Further reinforcing a peak/reversal threat is historically frothy sentiment/contrary opinion levels in both the Bullish Consensus (marketvane.net) and our proprietary RJO Bullish Sentiment Index shown in the weekly chart below. Indeed, current levels have warned of and accompanied every major peak/reversal environment since Jun’16’s 101.31 high. And the recent 81% reading in the RJOBSI is the highest in nearly EIGHT YEARS. Such historically frothy bullish sentiment and exposure by the Managed Money community seems odd to us given the market’s position still well within the middle-half bowels of a lateral 4-YEAR range and, we believe, warns of downside vulnerability that could be major in scope if the overall market forces the capitulation of this historically bullish exposure.
Finally, the weekly chart below also shows the market’s rejection thus far of the (95.85-area) upper-quarter of the 4-year lateral range. In effect, the current peak/reversal threat is identical to the conditions that warned of and accompanied Mar’18’s 96.15 high before an 8-month, 9-figure swoon.
These issues considered, traders are advised to move to a new bearish policy and exposure at-the-market (93.83) with a recovery above 94.66 required to defer or threaten this call enough to warrant its cover. Until and unless such 94.66+ strength is proven, further and possibly steep, accelerated losses are anticipated straight away.


