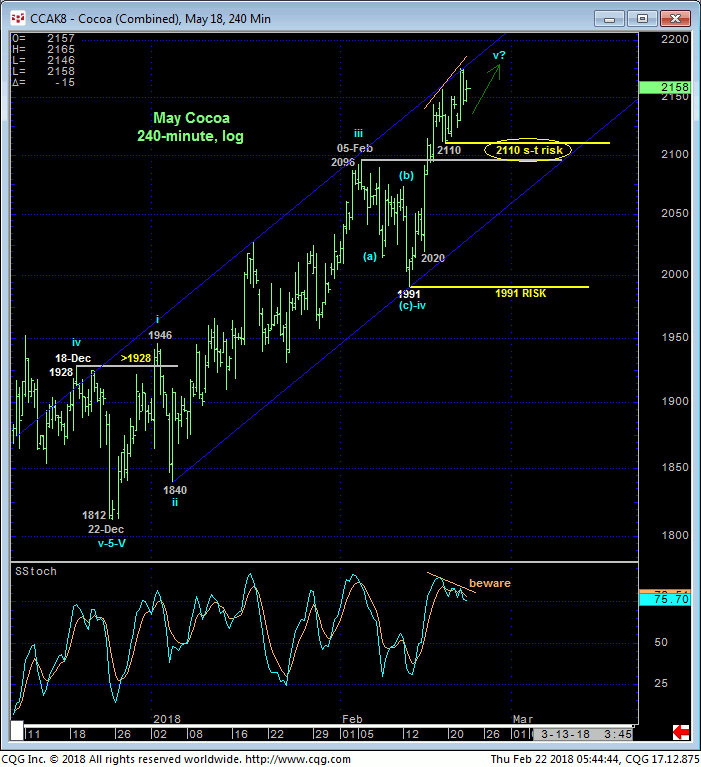
Yesterday’s continuation of the past couple months’ impressive rally leaves 16-Feb’s 2110 low in its wake as the latest smaller-degree corrective low the market is now required to sustain gains above to maintain a more immediate bullish count. Its failure to do so will confirm a bearish divergence in momentum that will break the portion of the uptrend from 12-Feb’s 1991 low. And while such a mo failure would be of an insufficient scale to conclude the end of the broader 2-month rally in and of itself, the market’s proximity to the extreme upper recesses of the 9-MONTH range amidst similar bullish sentiment conditions to that that warned of and accompanied early-Nov’s major peak and relapse provide enough ancillary evidence of another peak/reversal threat that even an admittedly short-term mo failure should be taken as a sign to take profits on longs from 1900 OB recommended in 03-Jan’s Trading Strategies Blog and move to the sidelines.


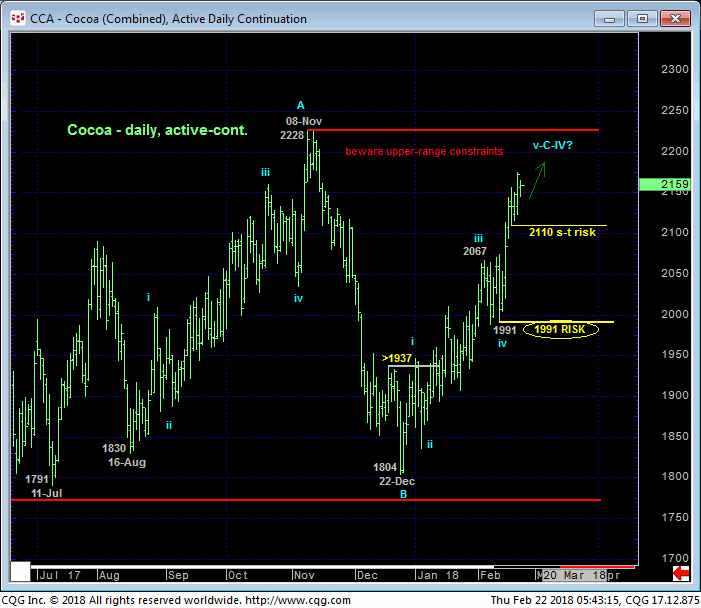
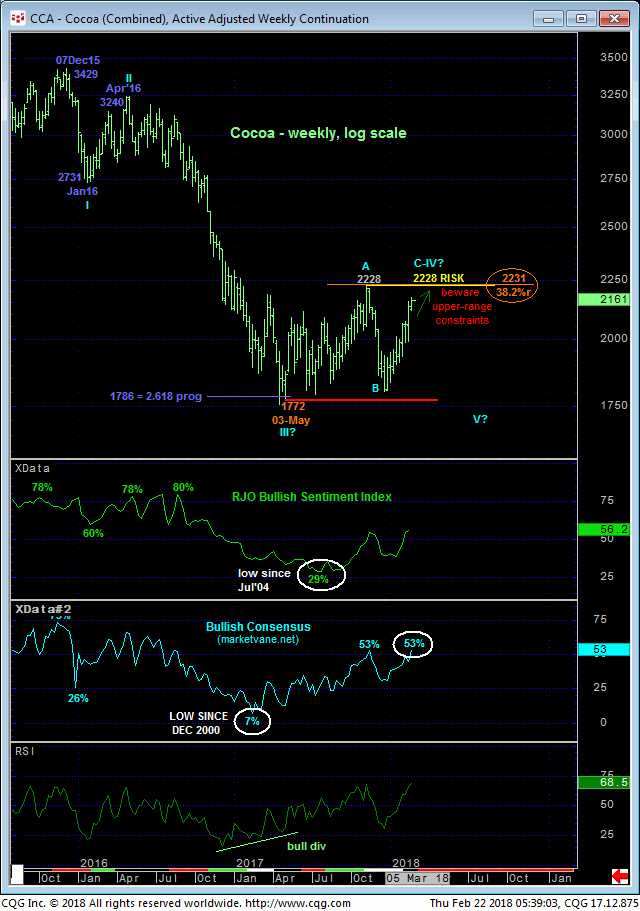
The daily chart above shows not only the market’s encroachment on the extreme upper recesses of the 9-month range (as does the weekly log chart below), but also the prospect that the rally from 12-Feb’s 1991 low is the completing 5th-Wave of the broader Elliott sequence up from 22-Dec’s 1804 low. And while the 53% and 56% readings in the Bullish Consensus (marketvane.net) and our RJO Bullish Sentiment Index are relatively neutral by long-term historical standards, these exact levels were in place when the market peaked and collapsed from 08-Nov’s 2228 high to 22-Dec’s 1804 low.
These issues considered, a bullish policy and exposure remain advised with a failure below 2110 required to threaten this call enough to warrant taking profits on longs from 1900 and moving to a neutral/sideline position. In lieu of such sub-2110 weakness further and possibly accelerated gains remain expected with a break above 08-Nov’s 2228 high exposing a long-term base/reversal environment that could be major in scope.


