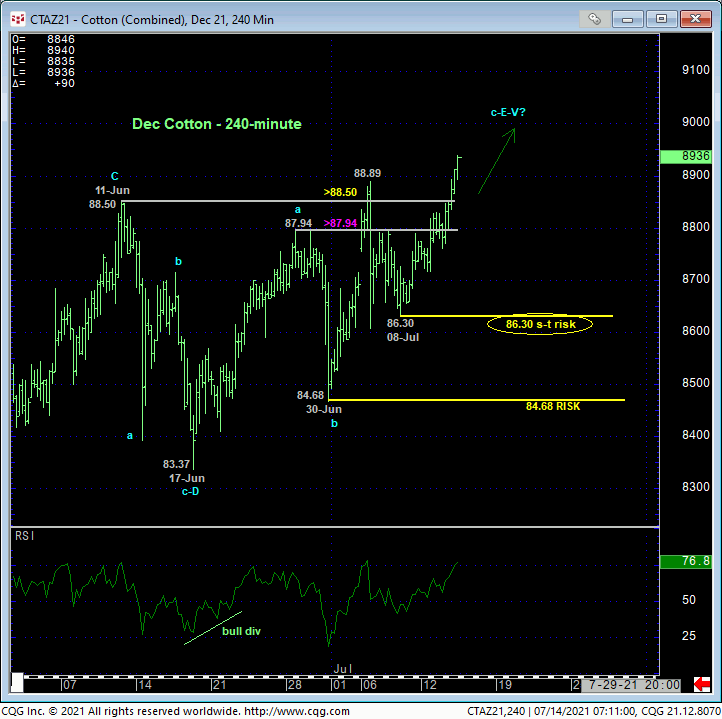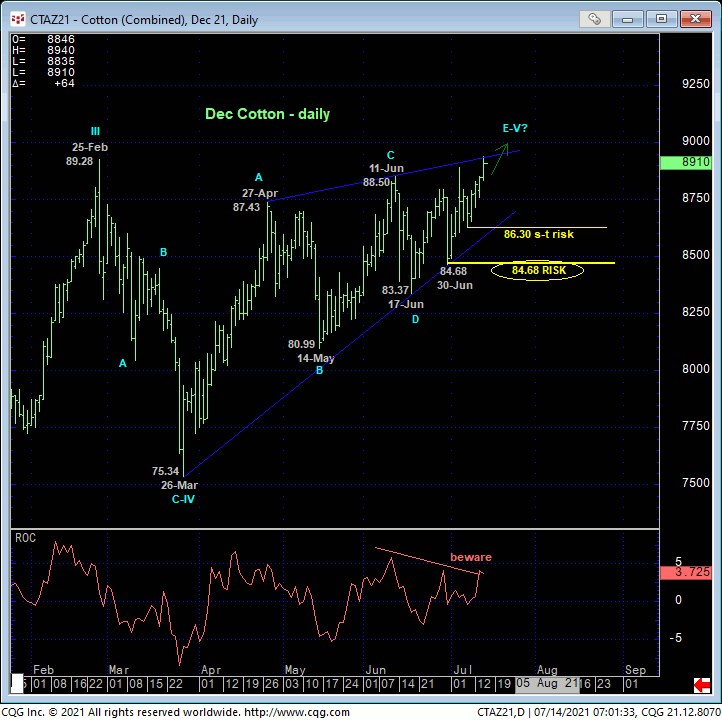

Overnight’s break above 06-Jul’s 88.89 high reaffirms the major bull trend, leaving new smaller- and larger-degree corrective lows in its wake at 86.30 and 84.68, respectively. Despite this strength reaffirming the secular bull trend in the Dec contract that could expose accelerated gains straight away, traders are advised to trail protective sell-stops on a still-advised bullish policy to these relatively tight corrective lows and risk parameters. Moving to a more conservative approach to risk assumption “up here” is predicated a number of factors:
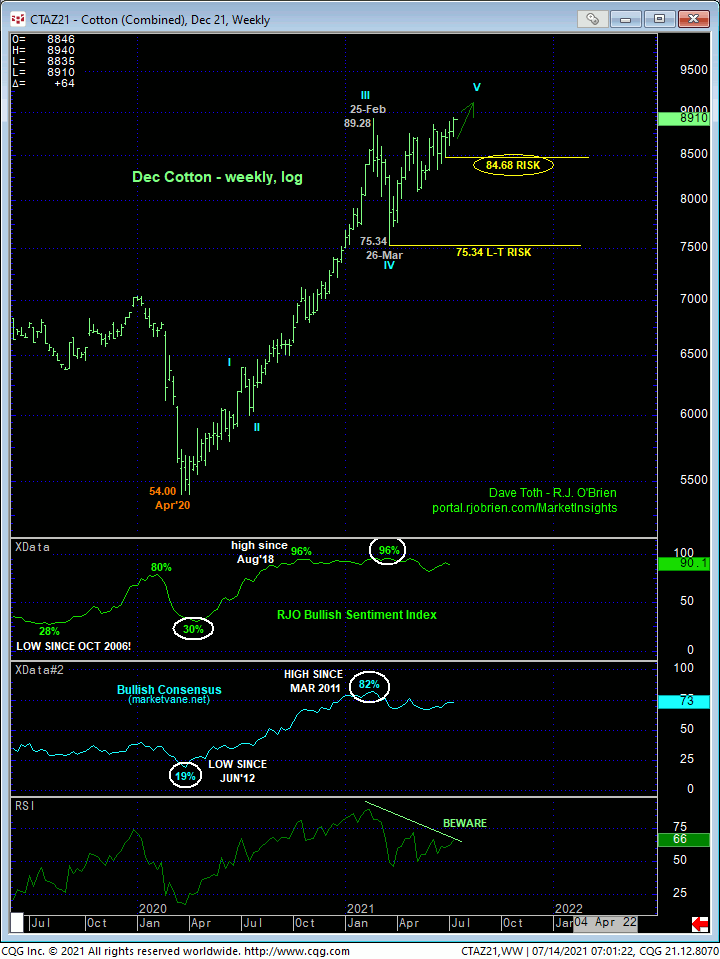
- waning upside momentum on both daily and weekly scales
- historically frothy sentiment/contrary opinion levels, and
- the prospect that the resumed bull from 26-Mar’s 75.34 low could be the completing 5th-Wave diagonal triangle of a massive Elliott sequence from Apr’20’s 54.00 low.
These are elements typical of major peak/reversal environments. However, they will only become applicable if/when the market threatens and then breaks the clear and present uptrend.
If we’re supposed to remain bullish/long this market (and we are), it is absolutely imperative that this market continued to BEHAVE LIKE A BULL by sustaining trendy, impulsive prices higher. We gauge such a requirement, quite simply, by the market’s ability to sustain gains above prior corrective lows like 86.30 and 84.68. Its failure to do so will be the first threats against the secular bull trend that would warrant defensive measures.
As for the clear “rising-wedge” (possible 5th-Wave diagonal triangle) pattern shown in the daily chart below, such patterns typically mean one of two things:
- a slowdown in the rate of ascent that precedes a reversal lower, or
- a sort of coiling-up” before the trend goes ballistic.
It will be interesting and opportunistic in the period immediately ahead to see which track this train takes.


The weekly log chart above shows the historically extreme bullish sentiment and upside momentum that arguably has been waning all year. Again, these elements are typical of major peak/reversal environments. However, they are not applicable in the absence of a confirmed accompanying bearish divergence in momentum needed to even threaten the secular bull, let alone break it.
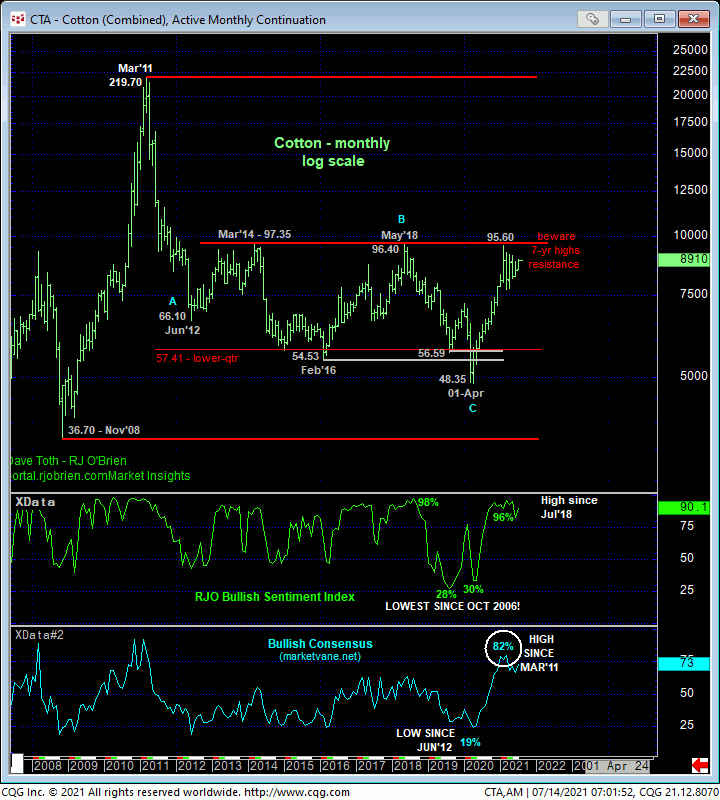
Additionally, the monthly log chart below shows the market’s proximity to the extreme upper recesses of a range that has repelled EVERY rally attempt over the past EIGHT YEARS. This is another peak/reversal-threat element that will come into play if/when the market starts proving at least short-term weakness below levels like 86.30 and 84.68. Until and unless such weakness is proven, further and possibly accelerated gains remain expected. This warrants a continued bullish policy and exposure with failures below 86.30 and 84.68 required to take defensive steps commensurate with one’s personal risk profile.


