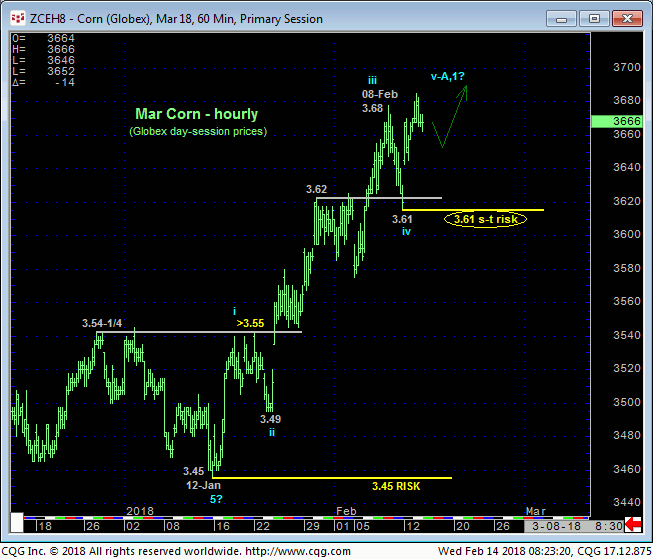
With yesterday’s run to yet another new high for what now is a month-long rally, the hourly chart below shows that the market has identified Fri’s 3.61 low as the latest smaller-degree corrective low it is now required to sustain gains above to maintain a more immediate bullish count. Its failure to do so will confirm a bearish divergence in momentum, break this uptrend and expose what we’d then suspect is a slightly larger-degree correction that could span a few weeks and, ultimately, produce an outstanding risk/reward buy for the foreseeable future. Per such 3.61 is considered our new short-term parameter from which the risk of a still-advised bullish policy and exposure can be objectively rebased and managed.


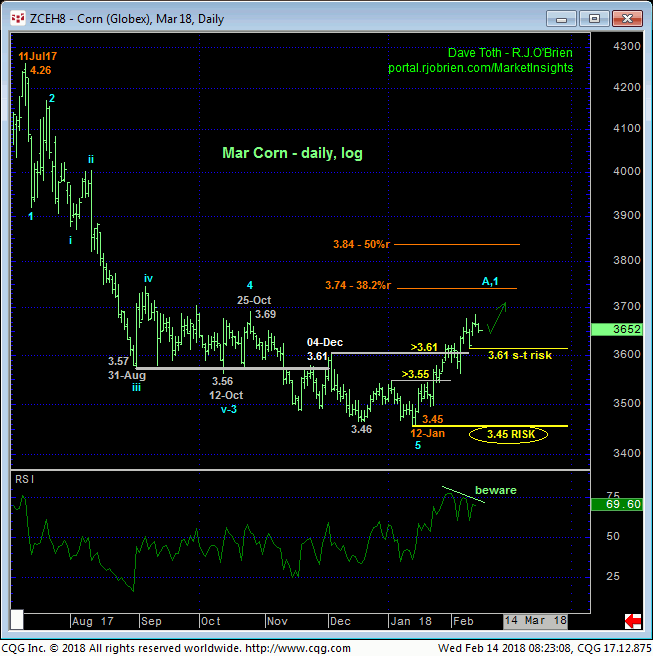
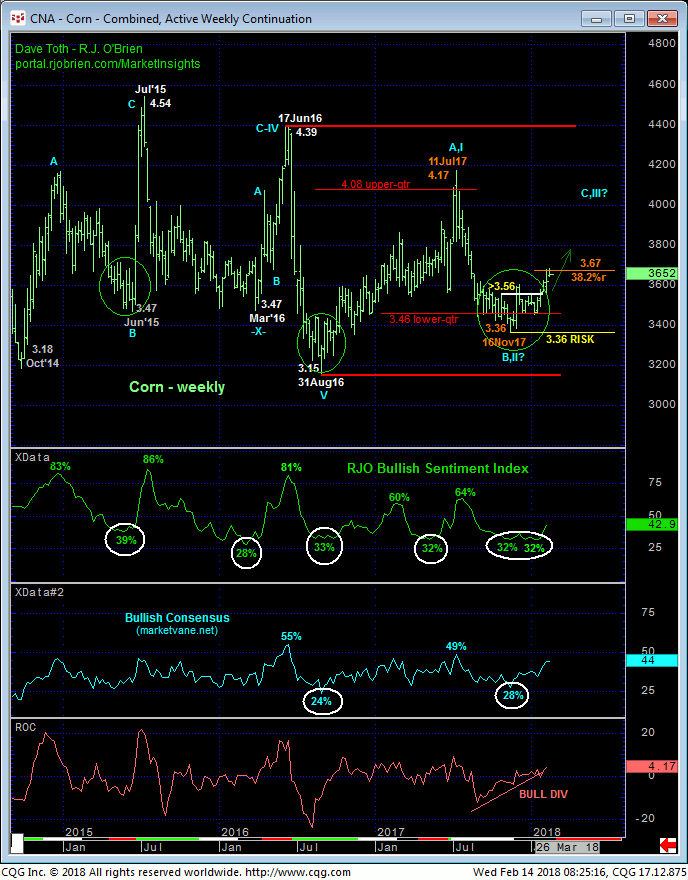
ON a broader scale the daily (above) and weekly (below) log scale charts show the market’s break of the entire Jul’17 – Jan’18 downtrend, exposing the new long-term trend as up. We’ve discussed the long-term base/reversal facts for months and the extent and (5-wave) impulsiveness of the past month’s rally satisfy two of our three major reversal requirements. Our third requirement of proof of 3-wave, corrective behavior on a subsequent relapse attempt arguably hasn’t unfolded yet; or has it?
Basis the Mar contract above we’re not sure if any of the little dips this market experienced within it’s rally from 12-Jan’s 3.45 low qualify as such a “larger-degree” correction within a broader base/reversal process. On an active-continuation chart basis below however, Dec-Jan’s relapse from 3.60 to 3.45 sell-off attempt does. And while this weekly log scale active-continuation chart below shows the market currently engaging the (3.67) 38.3% retrace of Jul-Nov’17’s 4.17 – 3.36 decline, there’s no way to know that the rally from 12-Jan’s 3.45 low isn’t the dramatic 3rd-Wave up that would be characterized by steep, even relentless gains.
Steep and relentless gains? IN CORN??? We’ve circled in green the similarities in the base/reversal processes over the past three years that have led to exactly such steep and relentless gains. If such is NOT what the market has in store for us next, or until later, then all its gotta do is weaken below at least 3.61. Until and unless such sub-3.61 weakness is shown, the long-term trend remains arguably up and should not surprise by its continuance or acceleration straight away. Under these circumstances we see little or no reason for producers to be hedged and every reason for end-users TO BE hedged.
In sum, a bullish policy and exposure remain advised with a failure below 3.61 required for shorter-term traders to move to the sidelines and longer-term players to pare bullish exposure to more conservative levels ahead of an interim and slightly larger-degree correction that could span a couple weeks. In lieu of such sub-3.61 weakness further and possibly accelerated gains remain expected straight away. The market’s upside potential is indeterminable and potentially severe, including a run at and possibly above the upper-quarter of the 3-year range (i.e. 4.05 or above).


