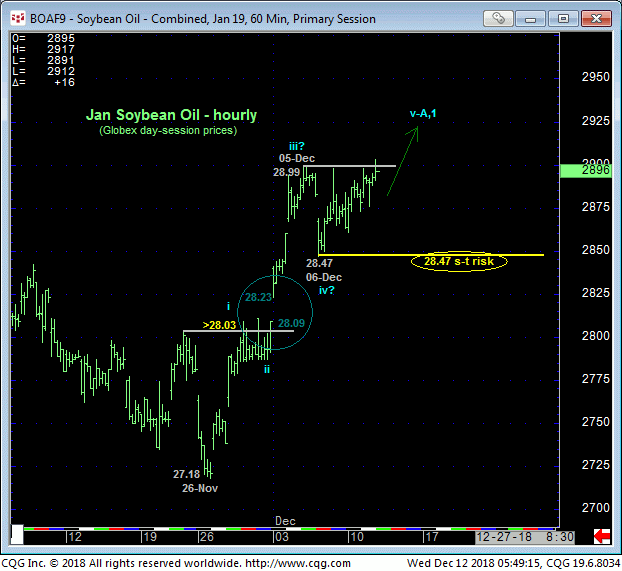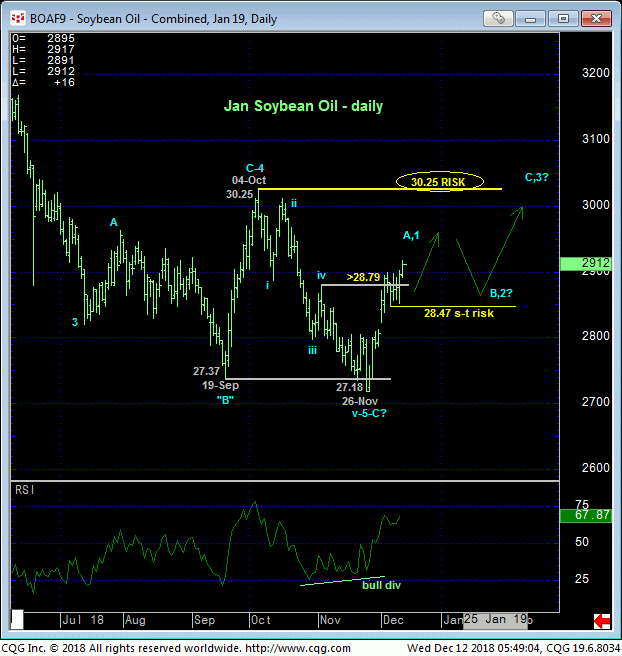
Yesterday and overnight’s continued rebound above early-Dec resistance from the 28.99-area reinforces our base/reversal count introduced in 04-Dec’s Technical Webcast and leaves 06-Dec’s 28.47 low in its wake as the latest smaller-degree corrective low the market is now required to sustain gains above to maintain a more immediate bullish count. Its failure to do so will confirm a bearish divergence in short-term momentum that would break the uptrend from 26-Nov’s 27.18 low and expose a not-unexpected (B- or 2nd-Wave) rebuttal to what we suspect is just the initial (A- or 1st-Wave) of a broader base/reversal PROCESS. In this regard that 28.47 low is considered our new short-term risk parameter from which shorter-term traders with tighter risk profiles can objectively rebase and manage the risk of non-bearish decisions like short-covers and cautious bullish punts.
In the hourly chart below we’ve also noted a minor gap between 28.09 and 28.23 resulting from 03-Dec’s gap-up open. Please note that we are NOT of the school that contends that “all gaps are closed” and this is a reason to “sell into” this clear and present intermediate-term uptrend. We would submit however that gaps so EARLY in a base/reversal process are unusual (as opposed to “breakaway gaps” in the 3rd-wave-stage of a reversal that are NOT closed). This could reinforce the prospects of an eventual (B- or 2nd-wave) correction of the current rally IF/when the market breaks this uptrend with a failure below 28.47.


Rare or the reversal processes that do not include an often times extensive (B- or 2nd-wave) correction of the initial counter-trend move as it takes TIME for the forces that have driven the previous major trend to erode to the point of reversal. Oct-Nov’s meltdowns straight from the respective highs across the energy complex are such rarities.
Probably, the forces that have driven a near-two-year decline in bean oil prices will take time to erode and this would be expected to be manifested in some correction of the current recovery from 26-Nov’s 27.18 low. But one thing about these initial (A- or 1st-wave) counter-trend moves is that there’s no way to determine their length until stemmed by a bearish (in this case) divergence in momentum below a level exactly like last Thur’s 28.47 minor corrective low and short-term risk parameter.
As for the base/reversal-threat environment that we believe could be major in scope, the technical FACTS on which this call is predicated still include:
- the market’s proximity to and rejection thus far of the extreme lower recesses of the 3-YEAR range
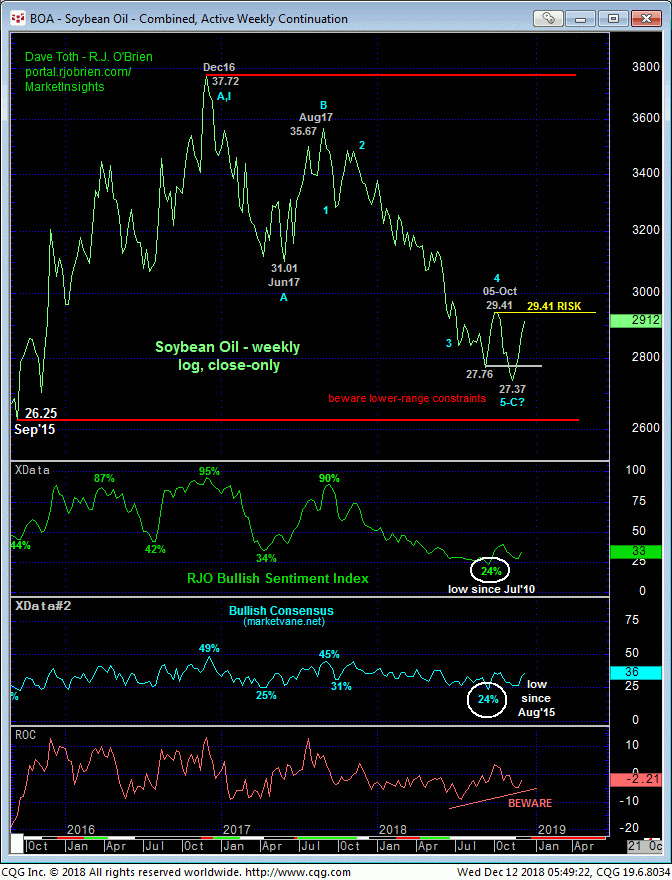
- a confirmed bullish divergence in daily mo on 04-Dec and the nicely developing potential for a divergence on a WEEKLY basis below that will be confirmed on commensurately larger-degree strength above 05-Oct’s 29.41 larger-degree corrective high and key risk parameter (30.25 on an intra-day basis)
- historically bearish sentiment levels that, in the case of our RJO Bullish Sentiment Index haven’t been seen in EIGHT YEARS and
- an arguably complete 5-wave Elliott sequence down from Aug’17’s 35.67 high weekly closed labeled below.
OK, so this last point is not a fact but rather a subjective call that requires proof of strength above 29.41 to confirm. But even Elliott Wave 101 students would be able to pick out this Aug’17-to-Nov’18 decline as a textbook example of what a 5-wave sequence should look like. Nonetheless and adhering to technical discipline, commensurately larger-degree strength above those early-Oct highs remains required to, in fact, break the 15-month downtrend, confirm the weekly divergence and 5-wave Elliott sequence and expose the new longer-term trend as up to the point of non-bearish action from long-term players.
These issues considered, a bullish policy remains advised for shorter-term traders with a failure below 28.47 required to interrupt this call and expose what we’d suspect is just an interim corrective relapse that would warrant the cover of cautious bullish exposure for redeployment later at what could be sub-28.00-area levels. Long-term players are OK to maintain cautious bearish exposure if they’d like with a recovery above 30.25 required to negate this call, warrant the cover of any remaining bearish exposure and move to a new bullish policy.


