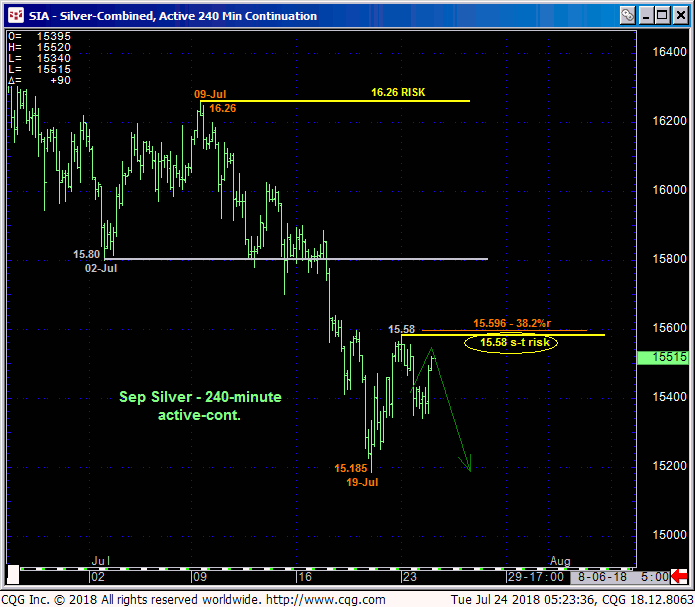
We won’t be able to conclude a more significant base/reversal threat by proof of smaller-degree strength above yesterday’s 15.58 high. Indeed, at that point the market would still be only around a Fibonacci minimum 38.2% retrace of just Jul’s 16.26 – 15.185-portion of the broader bear trend. But for a number of reasons we’ll discuss below, shorter-term traders with tighter risk profiles are advised to trail protective buy-stops on advised bearish exposure to levels just above that 15.58 high that we’re now considering our short-term risk parameter.
What we WILL be able to conclude from a poke above 15.58 is the intermediate-term trend as up as such strength will, in fact, leave 19-Jul’s 15.185 low intact as one of developing importance and also a corrective retest of that low (currently 15.34) as levels from which non-bearish decisions like short-covers and cautious bullish punts can be objectively based and managed. What heights exist above 15.58 at that point would be anybody’s guess.


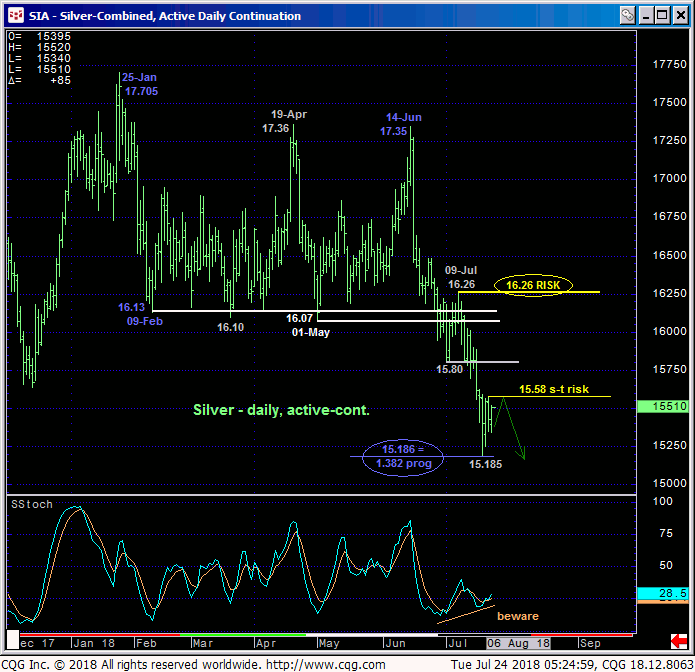
Our concern about the market’s upside potential following even a relatively smaller-degree bullish divergence in momentum above 15.58 stem from the following facts:
• that bullish divergence in mo from
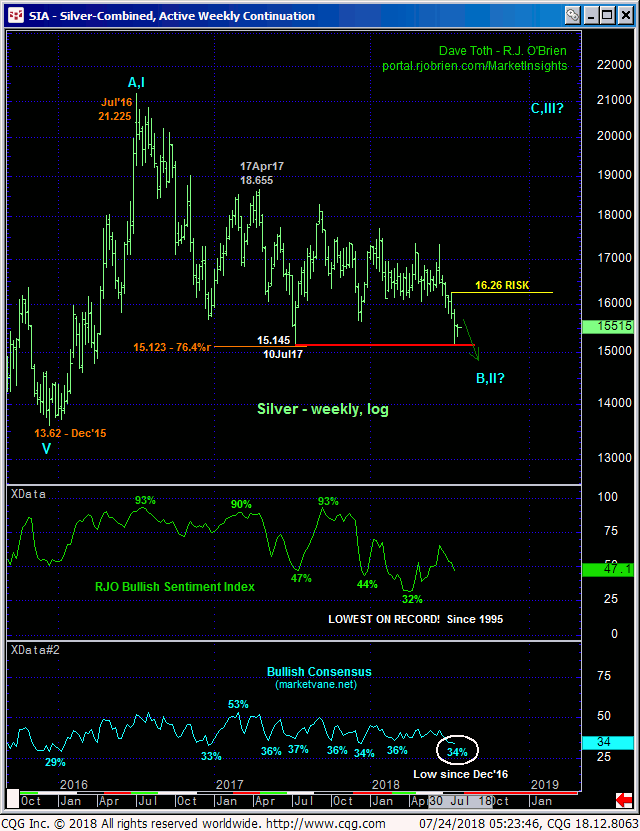
• the extreme lower recesses of the past year-and-a-half’s range shown in the weekly log chart below amidst
• historically bearish levels in the Bullish Consensus measure of market sentiment and
• the Fibonacci progression fact that the decline from 14-Jun’s 17.35 high is exactly 38.2% longer than Jan-Feb’s preceding 17.705 – 16.13 decline shown in the daily chart above.

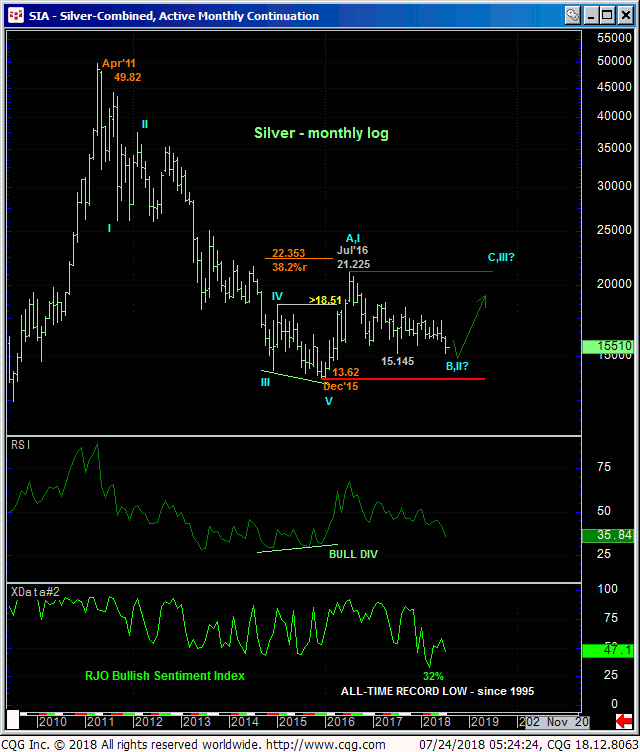
There’s also even the much longer-term base/reversal-threat issue shown in the monthly log scale chart below that contends that the extent and impulsiveness of early-2016’s rally from 13.62 to 21.225 BROKE the secular bear trend from 2011’s 49.82 all-time high and STARTED a major, multi-year correction or reversal higher. Against this base/reversal-threat backdrop the relapse attempt from Jul’16’s 21.225 high is considered a (B- or 2nd-Wave) correction ahead of an eventual (C- or 3rd-Wave) resumption of 2016’s rally to eventual new highs above 21.225.
Given the lateral-to-lower bludgeoning this market has incurred for two full years now, we understand traders’ lament over this long-term bullish count. But until and unless the market breaks Dec’15’s 13.62 low, eliminating such a bullish count from contention would be an emotional decision, not an objective one. And indeed, commensurately larger-degree proof of strength above 09-Jul’s 16.26 high and our long-term risk parameter remains minimally required to break Jun-Jul’s downtrend and resurrect/reinforce such a longer-term bullish prospect.
These issues considered, a bearish policy and exposure remain advised with a recovery above 15.58 required for shorter-term traders with tighter risk profiles to neutralize bearish exposure and circumvent the heights unknown of a correction or reversal higher that could surprise in scope. Commensurately larger-degree strength above 16.26 remains required for longer-term players to take similar defensive steps before reversing to a bullish policy. In lieu of such strength further losses remain expected.


