We don’t know if a 10-week, 32% rally constitutes a moon-shot or not, but with the exception of the 6-week, 38% explosion in Jun hogs this RBOB move is the biggest mover across all commodities we cover. Save for a short-term correction the last week of Mar, this move has been a one-way street, sustaining new highs above prior corrective lows the whole way. And while the May contract is quite a ways away from its 2.3533 high last Oct, as we’ll discuss below it’s closing in on last year’s 22-May high of 2.2804 basis the then-prompt Jul18 contract that cannot be ignored as a resistance candidate that warrants tightening up short-term bull risk.
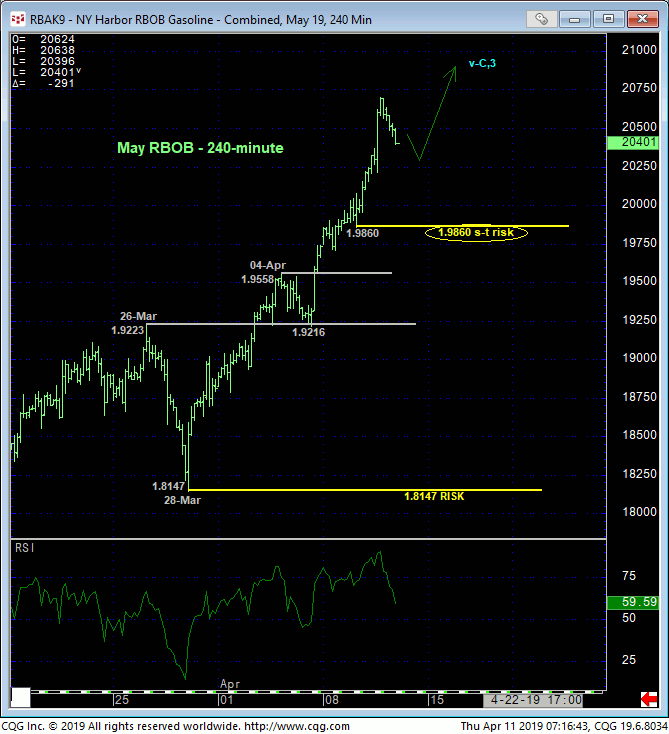
The challenge is identifying even a smaller-degree corrective low when the market goes straight up without any setbacks. In the 240-min chart below and without getting “too” tight, we see Tue’s 1.9860 low as one that would jeopardize the impulsive integrity of the portion of the uptrend from 05-Apr’s 1.9216 low if the market failed below it. Per such we are defining this 1.9860 level as our new short-term risk parameter the market minimally needs to fail below to warrant defensive steps by shorter-term traders with tighter risk profiles.


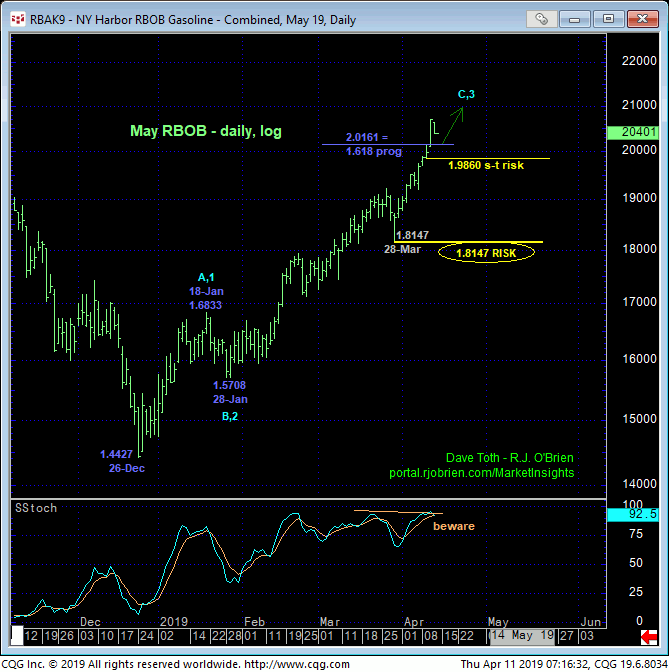
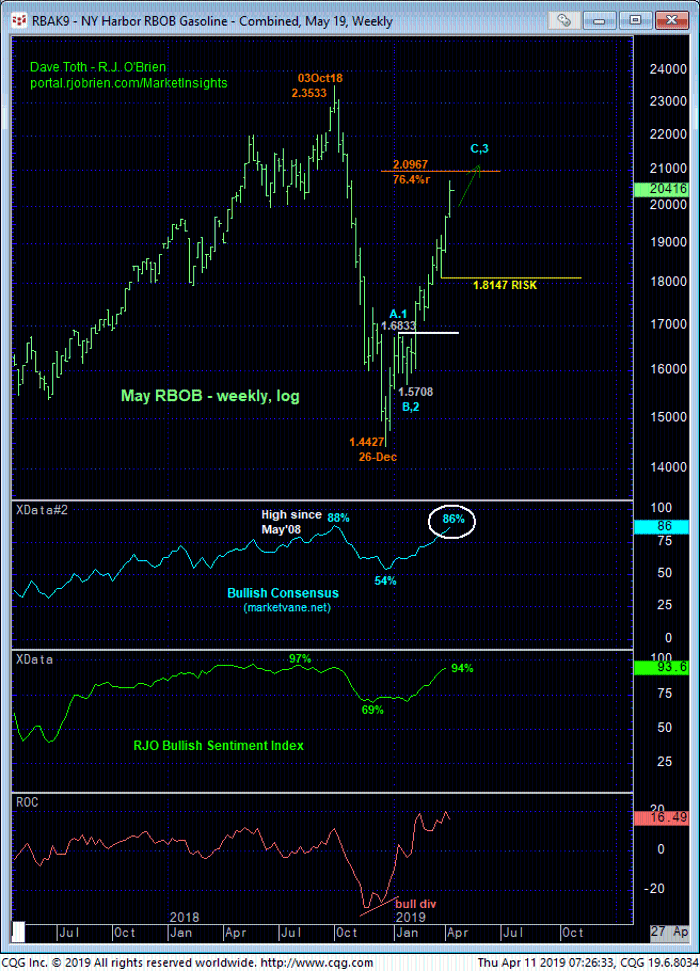
The daily (above) and weekly (below) log scale charts of the May contract clearly show the trend as up on all scales. 28-Mar’s 1.8147 corrective low is the closest larger-degree corrective low the market is required to fail below to, in fact, break the major uptrend to the point of non-bullish action like long-covers by longer-term players. And even then, this would “only” break the uptrend from 28-Jan’s 1.5708 low, not necessarily the major rally from 26Dec18’s 1.4427 low.
Given the 3rd-wave-manner in which the market continues to perform, we strongly suspect a relatively large (4th-wave) correction/consolidation (similar to Jan/Feb’s 1.6833-to-1.5708 “area’) ahead of a final, exhaustive (5th-wave) continuation of the bull before we can more objectively start negotiating a prospective top. Following such behavioral requirements, we’ll then be able to trail our longer-term risk parameter to that low of that (suspected 4th-wave) consolidation.
Market sentiment levels have understandably return to frothy heights typical of major PEAK/reversal conditions, but traders are reminded that sentiment/contrary opinion is not an APPLICABLE technical tool in the absence of an accompanying confirmed bearish divergence in momentum of a scale sufficient to break the major uptrend. And given the prospect/requirement of at least a (4th-wave) consolidative before a subsequent resumed (5th-wave) rally to another round of new highs, this bull is arguably going to be around for a while, and perhaps through the summer driving season.

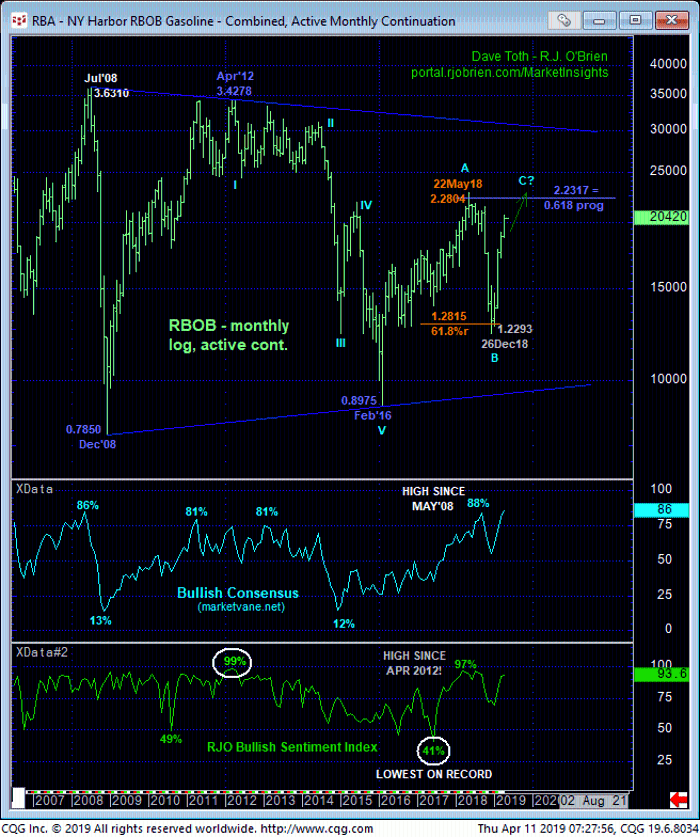
Finally, the monthly log scale chart of the most active contract below shows the market’s current position still pretty much in the middle-half bowels of its historical that actually dates back to 2005! On this basis the market is closing in on 2018’s 2.28 high and the 2.23-area that makes the recovery attempt from Feb’16’s 0.8975 low 61.8% of the length (i.e. 0.618 progression) of Dec’08 – Apr’12’s 0.7850 – 3.4278 previous rally attempt of this size.
This Fibonacci progression fact was an interesting accompaniment to 2018’s peak/reversal condition and may be so again. But as with all merely “derived” technical levels like Bollinger Bands, imokus, trend lines, the ever-useless moving averages, this Fib relationship should NOT be considered a reliable reason to expect resistance. ALL of these derived levels NEVER have proven to be reliable reasons to buck a trend in the absence of a trend-stemming bearish (in this case) divergence in momentum, and they never will. And herein lies the importance of identifying a corrective low and risk parameter like 1.8147 (currently) as THE key to navigating a peak/reversal environment. IN lieu of such a mo failure, the market’s upside potential is indeterminable and potentially extreme, even above 2.28.
These issues considered, a full and aggressive bullish policy remains advised with a failure below 1.9860 for shorter-term traders to pare or neutralize bullish exposure. Commensurately larger-degree weakness below 1.8147 remains required for long-term players to move to the sidelines. In lieu of such weakness, further and possibly accelerated gains remain expected.


