Posted on Aug 15, 2022, 11:38 by Dave Toth
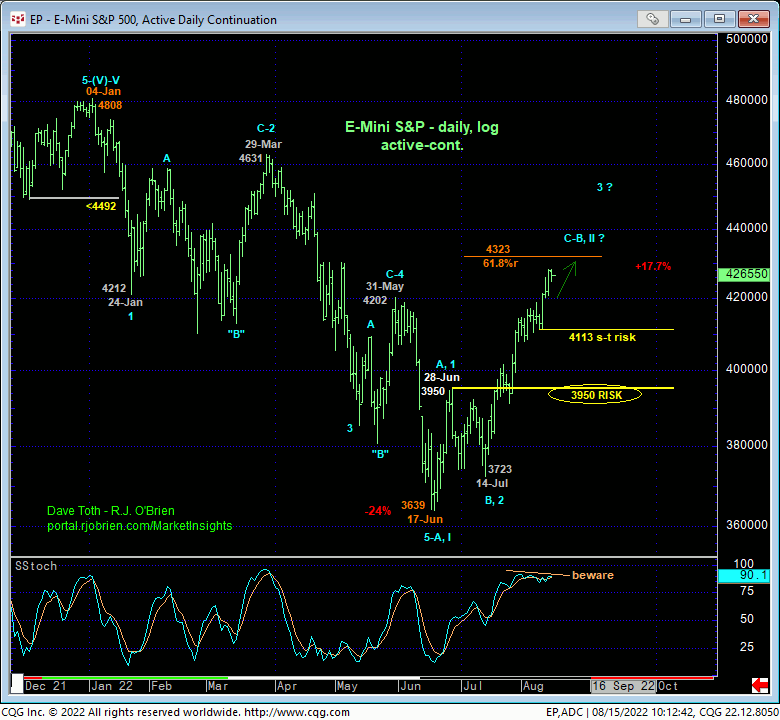
In 24-Jun’s Technical Blog we introduced the prospect for an approximate 15%-to-18% bear market rally. With today’s continuation of this recovery, the market is nearing an 18% return from 17-Jun’s 3639 low and the (4323) 61.8% retrace of Jan-Jun’s 4808 – 3639 decline. But these merely “derived” levels are NOT resistance and a reason to sell…yet. Indeed, only a glance at the daily log scale chart below is needed to see that the uptrend is clear and present and should not surprise by its continuance or acceleration.
What’s important about identifying certainly so-called “technical levels” is to raise awareness of such levels as “areas of interest” around which to be on the lookout for the markets signal that this uptrend has ended. And the technical tool we use to navigate ends of trend is MOMENTUM. We need a confirmed bearish divergence in momentum to arrest this clear and present uptrend and reject/define a more reliable level from which non-bullish decisions like long-covers and bearish punts can only then be objectively based and managed. Until and unless such a mo failure stems the rally, its upside potential is indeterminable and potentially extreme. As discussed as an alternate wave count, we could be 100% wrong on a new major bear market with Jan-Jun’s decline a complete correction ahead of a resumption of the secular bull trend. IF this is the case however, then this market needs to BEHAVE LIKE A BULL by sustaining trendy, impulsive behavior higher, NOT rolling over in a confirmed bearish divergence in mo.
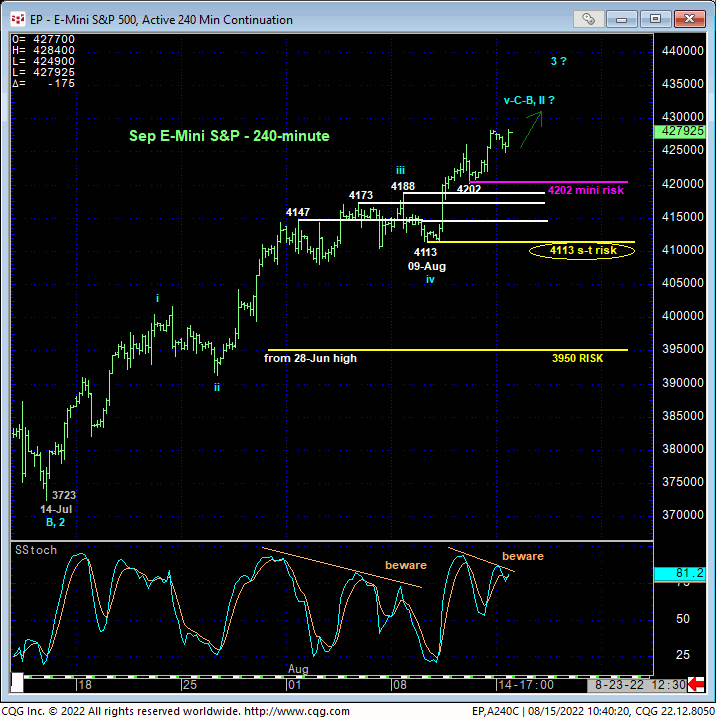
In the daily log chart above and 240-min chart below, we’ve identified three levels below the market it would be expected to sustain gains above if there’s something broader to the bull side going on. First and on the teeniest of scale, Fri and today’s continuation of the rally leaves Thur’s 4202 low in its wake as the latest smaller-degree corrective low and area of former resistance-turned-support. For very short-term traders, a failure below 4202 and our mini bull risk parameter would confirm a bearish divergence in very short-term momentum and be cause to take profits and head to the sidelines.
Secondly and more importantly, last week’s break above the prior weeks’ resistance between 4147 and 4188 reaffirms the bull and defines 0-Aug’s 4113 low as an intermediate-term corrective low and one that this market should sustain gains above per any broader bullish count, especially since that former 4188-to-4147-area resistance, since broken, now serves as new near-term support. If this market fails below 4113, especially over the course of the next week or so, this will not only break the uptrend from 14-Jul’s 3723 low, but reinforce our peak/reversal count that could be massive in scope. Per such, we’re defining 4113 as our short-term but pivotal risk parameter around which traders are advised to toggle directional biases and exposure.
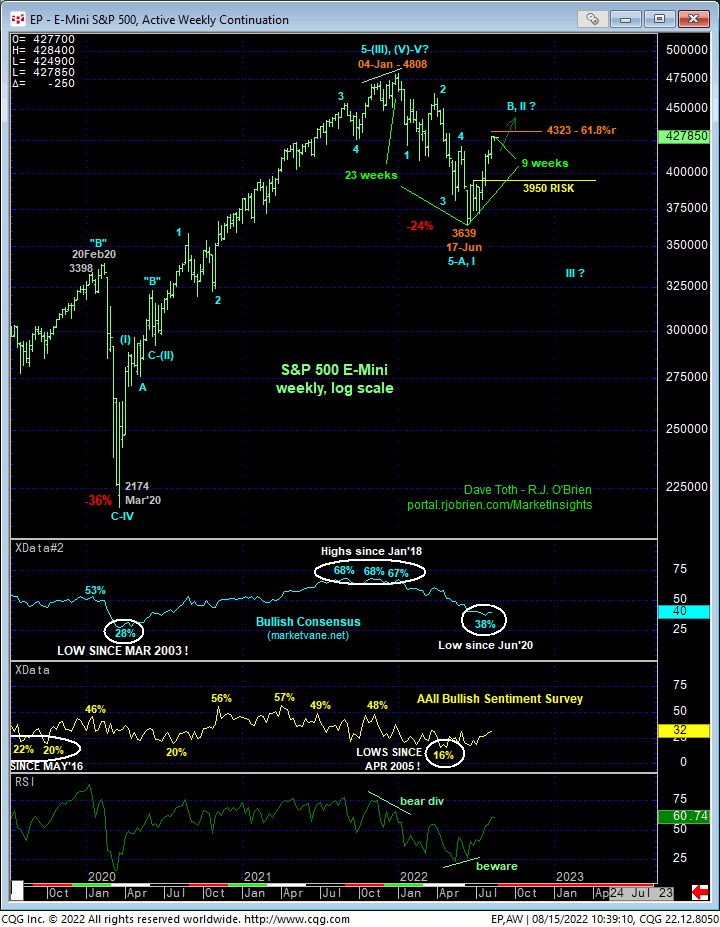
Finally, in the daily chart above, we’ve labeled 28-Jun’s 3950 high as the end of either an A- or a 1st-Wave. IF an alternate major bullish count is what this market has in mind, it must stay above 3950 in a prospective and dramatic 3rd-Wave rally from 14-Jul’s 3723 low. Such a count would be characterized by sustained, trendy, impulsive and increasingly obvious behavior higher. A failure below 3950 would render the recovery from 17-jun’s 3639 low a 3-wave and thus corrective affair consistent with our major bearish count and, we believe, expose 2008-2009-type of nasty thereafter. Per such, 3950 is our long-term bull risk parameter line in the sand.
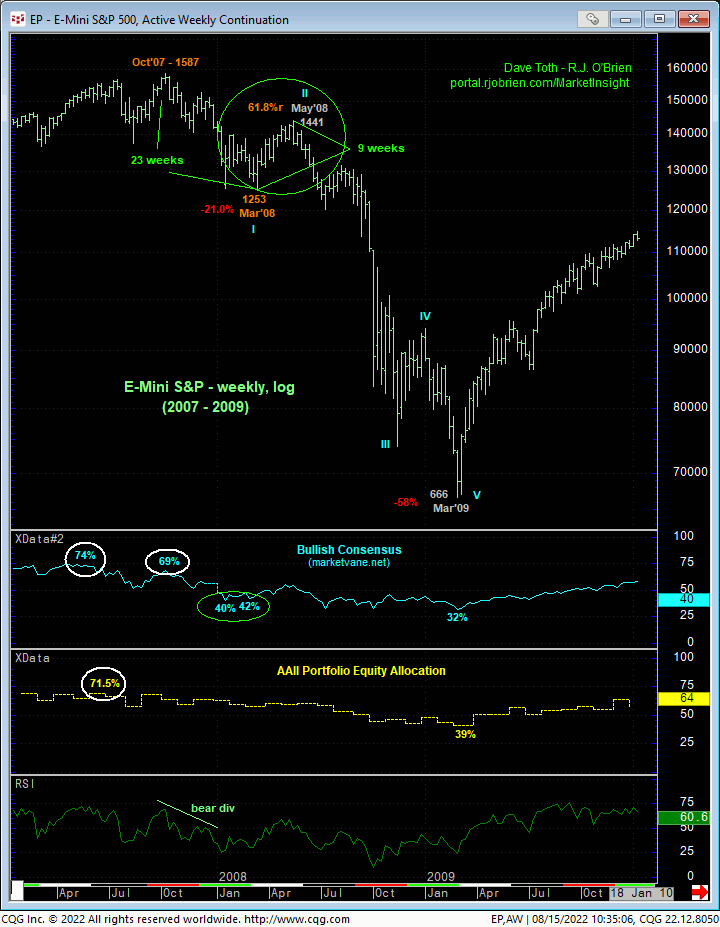
For months now, we’ve discussed peak/reversal elements that this market hasn’t seen since those that warned of and accompanied a major 2-year lateral correction from Jan2018’s high and two major bear markets that began in Oct 2007 and 1Q2000. Thus far this year, price action has unfolded virtually identically to the Oct’07 – May’08 topping process before the 3rd-Wave bottom fell out. After Oct’07 – Mar’08’s initial 21% drawdown, the market retraced nearly 61.8% of that INITIAL drop in a 2nd-Wave CORRECTION WITHIN that major topping process.
Additionally, that initial decline from Oct’07’s 1587 high spanned 23 weeks. The subsequent correction spanned 9 weeks, exactly 38.2% of the time the 1st-Wave down took before the dramatic 3rd-Wave down took hold.
In the weekly log chart of current S&P prices below, the market lose 24% over an identical 23-week span. THIS week is the 9th-week of this correction, or 38.2% of the time it took for Jan-Jun’s decline to unfold! This recovery is also a smidge away from its (4323) 61.8% retrace of Jan-Jun’s 4808 – 3639 decline. Eerie. BUT….
…These merely “derived” relationships are only “interesting”. They are NOT resistance and NOT considered a reason to sell this market at this time. IF, HOWEVER, this market starts failing below levels like 4202 initially and then especially below 4113, the confluence of factors will warrant not only neutralizing any/all bullish exposure, but preparing for a move south that could rival or exceed the 2007-2009 and 2000-2002 major bear markets.
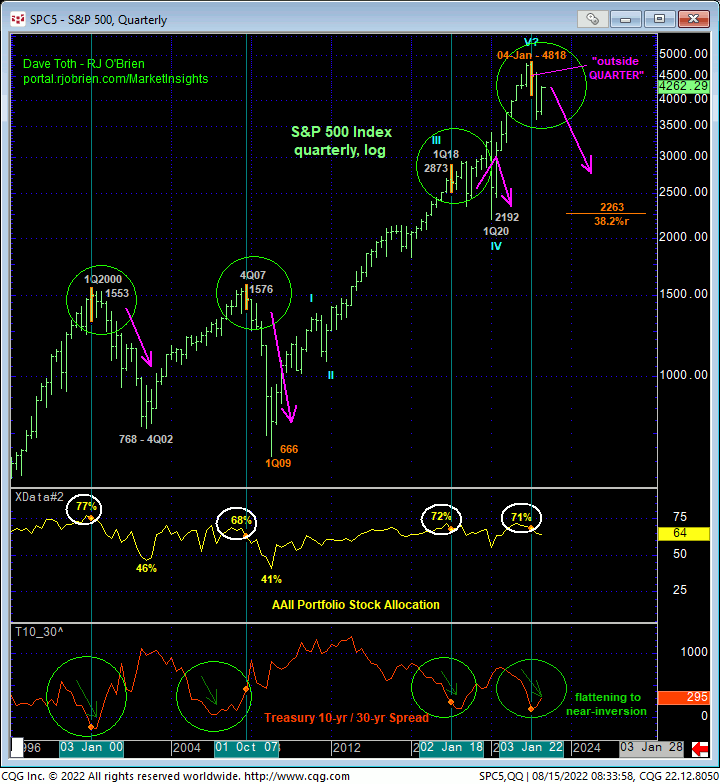
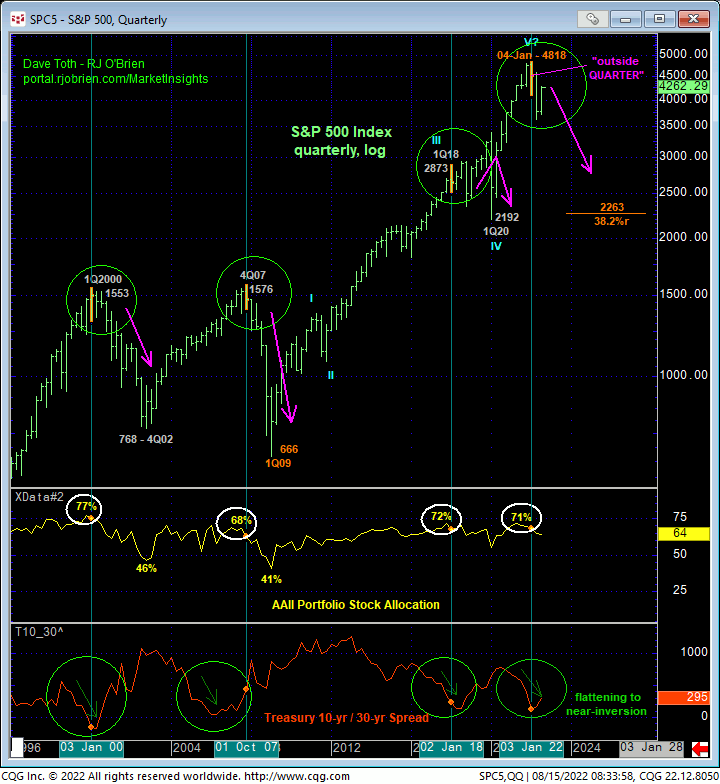
On an even longer-term basis, the monthly (above) and quarterly (below) log scale charts show the unique and compelling combination of:
- major bearish divergences in momentum
- “outside month down”
- “outside QUARTER down”
- historically frothy sentiment/contrary opinion/equity portfolio allocation levels
- flattening/inverting yield curves
- and arguably complete 5-wave Elliott sequence from Mar 2009’s 666 low
on which our major peak/reversal count remains predicated. Yes, the past couple months’ recovery is not unimpressive. but longer-term traders and investors should be aware that such recovery attempts are common and fall well within the bounds of mere corrections within major bear markets. For the reasons cited at the beginning of today’s analysis, we may be close to this correction’s end and the major bear’s resumption. HOWEVER, PROOF of weakness below at least 4202 and especially 4113 is required to defer and then arrest this recovery to the point of non-bullish action. Until and unless such weakness is proven, further and possibly accelerated gains remain anticipated straight away. But stay tuned, because we believe the next week or two and current levels may hold the key to a tremendous risk/reward opportunity to the bear side.
