Posted on Mar 24, 2023, 10:12 by Dave Toth
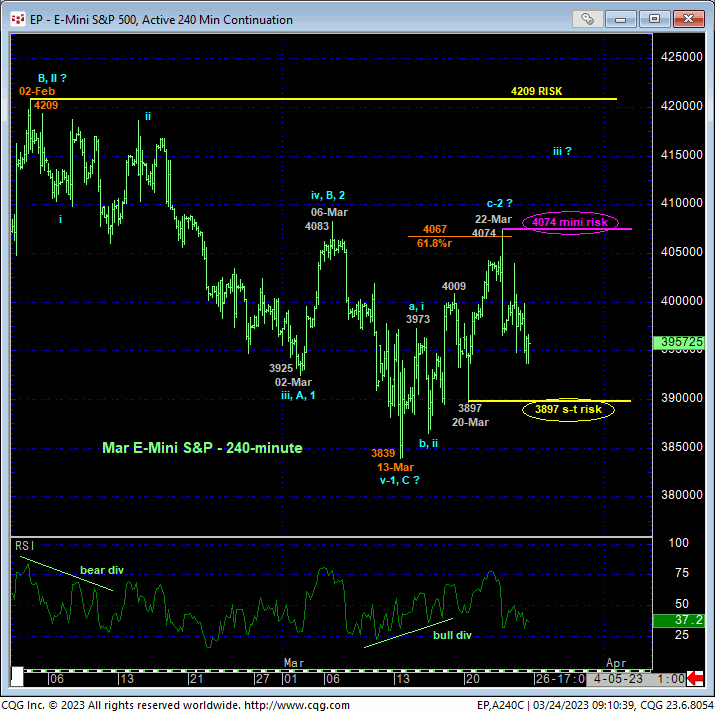
In recent updates we’ve discussed the market’s treacherous position in the middle-half bowels of the past five months’ lateral range, where the odds of aimless whipsaw risk are approached as higher, warranting a more conservative approach to directional risk assumption. Indeed, only a glance at the 240-min chat below is needed to see this continued lateral chop over the past month. What warrants heightened scrutiny however is the past couple days’ relapse that stems from the immediate area of the (4067) 61.8% retrace of Feb-Mar’s 4209 – 3839 decline following what thus far is only a 3-wave recovery from 13-Mar’s 3839 low to Wed’s 4074 high. Left unaltered by a recovery above 4074, and reinforced by further weakness below Mon’s 3897 low, the past couple weeks’ 3-wave recovery attempt may be considered a corrective/consolidative event that warns of a resumption of Feb-Mar’s downtrend that preceded it.
In this very short-term but important range-center regard, we believe the market has identified 4074 and 3897 as tight but key levels around which directional biases and exposure can be objectively toggled. Which side of this range the market takes out first could have longer-term implications given apparent and increasing flight-to-quality performances in the gold and interest rate markets.
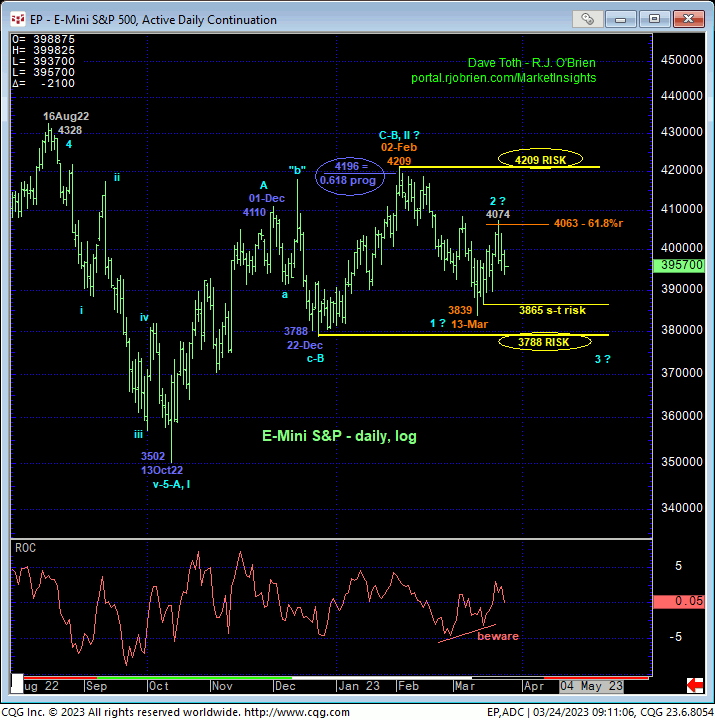
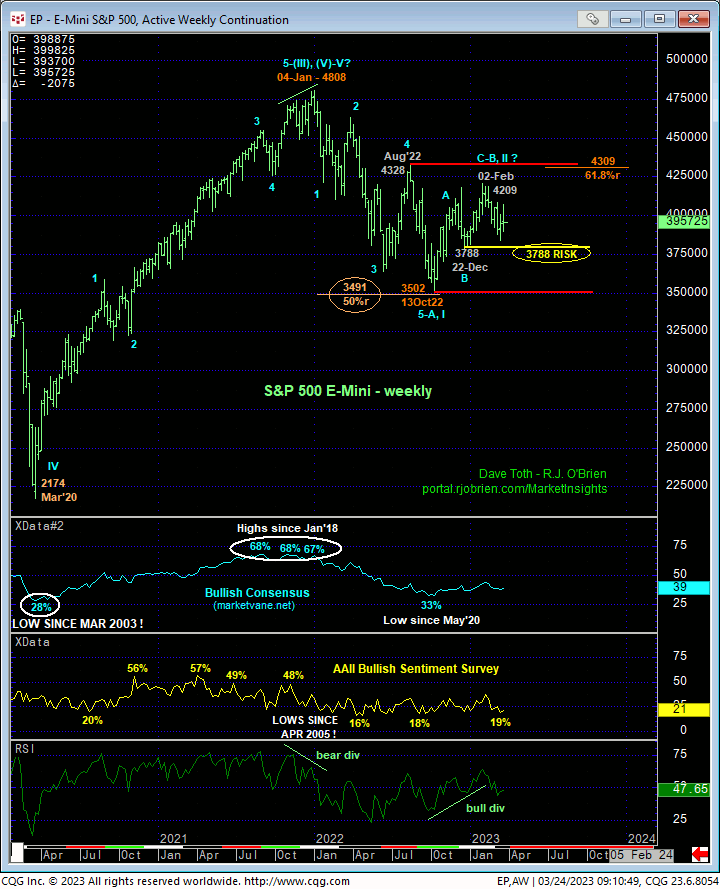
Stepping back a bit, both the daily log chart above and weekly chart below show this market still locked deep within the middle-half bowels of the lateral range that has constrained prices for the past five months. We know for a technical fact that this non-trending behavior can be only one of two things: corrective/consolidative before a resumption of last year’s downtrend that preceded it OR a reversal of last year’s downtrend. In recent updates we have identified 02-Feb’s 4209 high and 22-Dec’s 3788 low as the longer-term bear and bull risk parameters, respectively, that this market needs to break to reinforce either a longer-term bearish count or bullish count. Longer-term institutional players and investors remain urged to acknowledge and be flexible to either inevitable directional outcome, but especially on the bear side below 3788 given the past couple days’ setback detailed above as well as some startling moves in some related interest rate markets and old we discuss below.
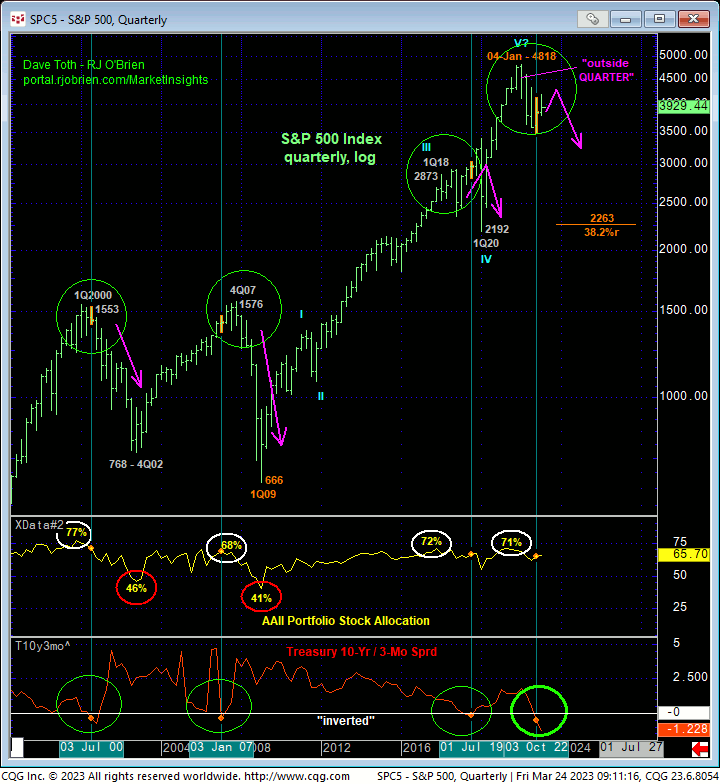
On an even longer-term scale, the quarterly log scale chart of the E-Mini S&P still shows the elements on which our major peak/reversal/bear market count remains predicated:
- a bearish divergence in long-term momentum amidst
- what was historically extreme bullish sentiment
- an arguably textbook and massive complete 5-wave Elliott sequence from 2009’s 666 low, and, perhaps most importantly,
- the inverted 3-month-to-10-yr Treasury yield curve that warned of and accompanied all three of the previous major corrections or reversals lower.
The market as yet to provide the technical/pricing evidence to mitigate this unique and compelling confluence of factors that still warns to first approach the recovery attempt from last Oct’s 3502 low as a (B- or 2nd-Wave) correction ahead of an eventual resumption of last year’s downtrend that preceded it. To even defer, let alone threaten this long-term bearish count, the market needs to recoup 02-Feb’s 4209 high. A break below 22-Dec’s 3788 low will not only reinforce this bearish count, but could open the floodgates to it.
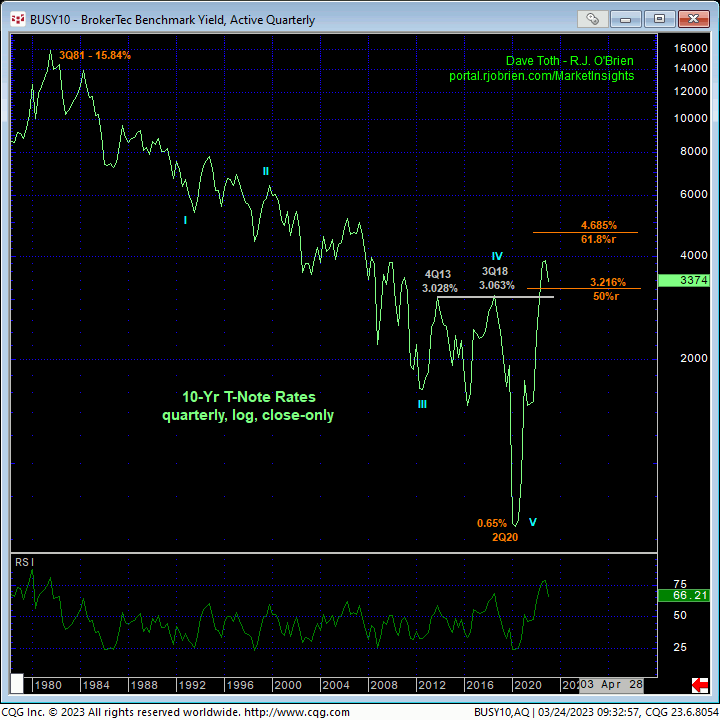
Lastly, and keeping in mind the recent events of inflation and the banking issues, we’d like traders and investors to consider some of the short- and long-term goings-on in the interest rate sector. First, the quarterly log close-only chart of 10-yr Treasury yields above shows the generational 39-YEAR downtrend in rates from 1981’s inconceivable high of 15.84% to 2020’s 0.65% low. In very short, even violent order, the market has retraced more than 50% of this 39-year decline after the government opened its massive, massive, massive money spigot to combat COVID and the risk of recession. As a result, anyone, and especially banks, who bought Treasury securities over the past 15 YEARS are now under water in these investments. The ramifications of this major exposure and extreme but reflective market moves over a relatively concentrated period of time are indeterminable but potentially equally extreme.
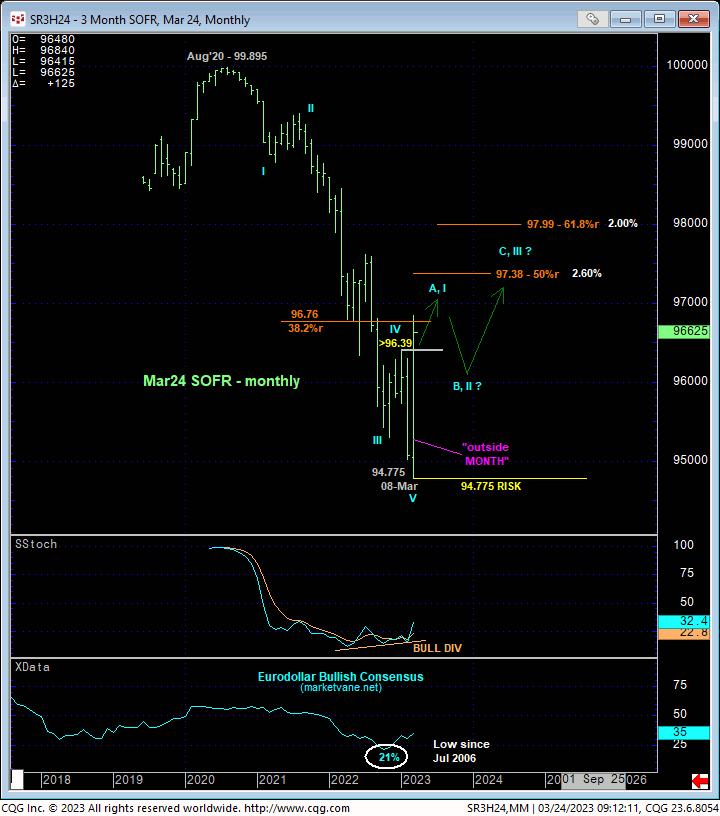
In addition to gold’s exceptional performance from 03Nov22’s $1,618 low (+24.5%) and recent quality-flight continuation of this rally, we’d also like to point out this month’s mammoth reversal of the 31-MONTH secular bear trend in short-term interest rates as indicated by the monthly chart of the Mar24 SOFR (Secured Overnight Financing Rate) contract below. In this morning’s Technical Blog, we discussed the BASE/reversal elements that are every bit as massive and compelling as those that warned of and accompanied 2020’s major top and reversal into a new secular bear market. So what’s behind such an egregious move higher in short-term (as well as longer-term) rates? In a nutshell, FEAR, and uncertainty. Traders and investors are flocking to quality Treasury paper because of the unknown. And per our latest technical assessment, these is more of this to come in the weeks, months and perhaps even quarters ahead.
All these issues considered, getting back to stocks and the Jun E-Mini S&P, while 22-Dec’s 3788 low and 02-Feb’s 4209 high remain intact as the key bull and bear risk parameters around which to toggle longer-term directional biases and exposure, we believe the past couple weeks’ price action identifies Mon’s 3897 low and Wed’s 4074 high as the key short-term directional flexion points, the break of either end of which will increase the odds of a more protracted move in that direction. Per such, flexibility to either directional outcome and the awareness of a potentially major move south if those lower levels are violated first are urged.
