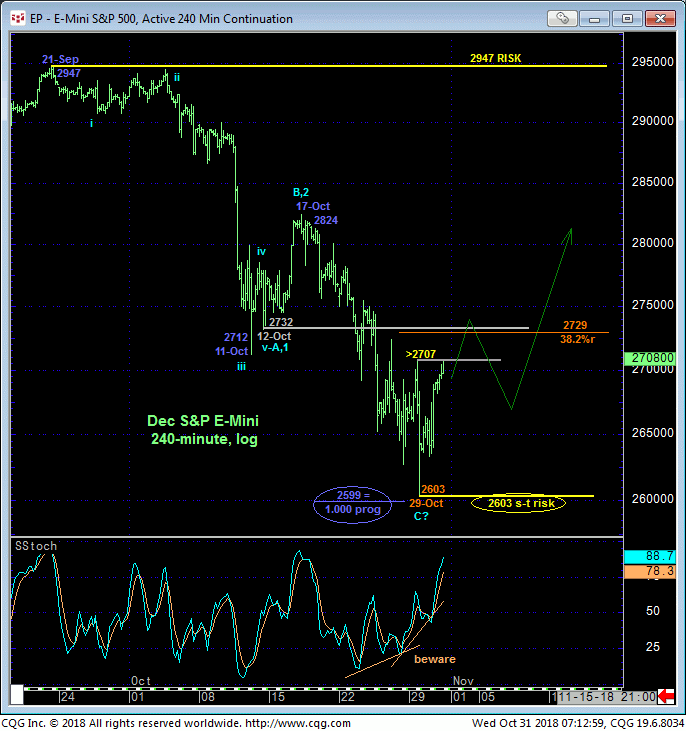
In yesterday’s Technical Blog we identified Mon’s 2707 minor corrective high as the level the market needed to sustain losses below to maintain a more immediate bearish count. Its failure to do so this morning confirms a bullish divergence in short-term momentum as detailed in the 240-min chart below. This mo failure only allows us to conclude the end of the downtrend from 17-Oct’s 2824 high, NOT the entire month’s meltdown from 21-Sep’s 2947 high. But for additional reasons we’ll discuss below, such a more protracted corrective rebuttal of this decline or even possibly a resumption of the secular bull trend should not come as a surprise.
The key takeaway here is that as a direct result of this confirmed bullish divergence in momentum, the market has identified a specific low and support at 2603 from which any non-bearish decisions like short-covers and cautious bullish punts can now be objectively based and managed. And traders are advised to do so.
We anticipate some initial resistance from the 2730-area identified by former support from this area in early-Oct and also because of the (2729) 38.2% retrace of Sep-Oct’s 2947 – 2603 decline. But against the backdrop of the secular bull trend and the severe obviousness of what might only be the INITIAL decline in a much larger-degree peak/correction/reversal PROCESS, a more extensive corrective rebound in terms of both price and time is expected in the weeks ahead.


The factors on which this steeper corrective rebound OR the resumption of the secular bull are predicated include:
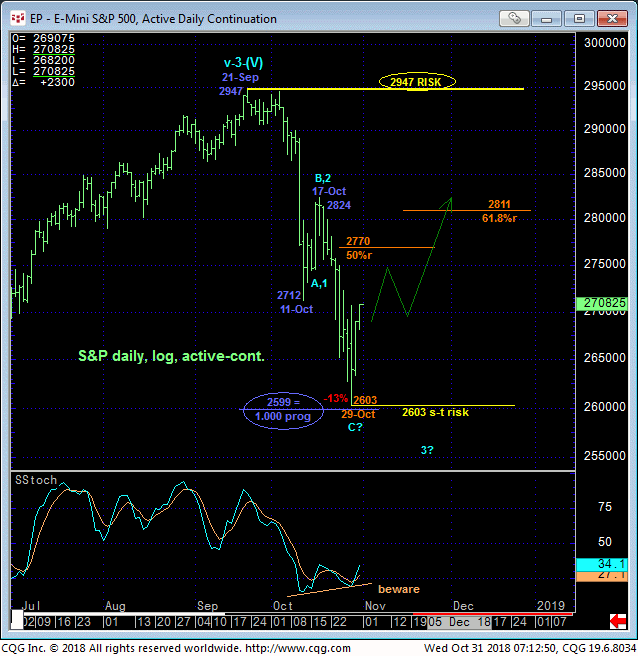
- waning downside momentum on a daily basis above (confirmed above 17-Oct’s 2824 corrective high)
- the Fibonacci fact that the resumed (and prospective C-Wave) decline from 17-Oct’s 2824 high came within a measly four points of the (2599) 1.000 progression of the initial counter-trend break from 2947 to 2712
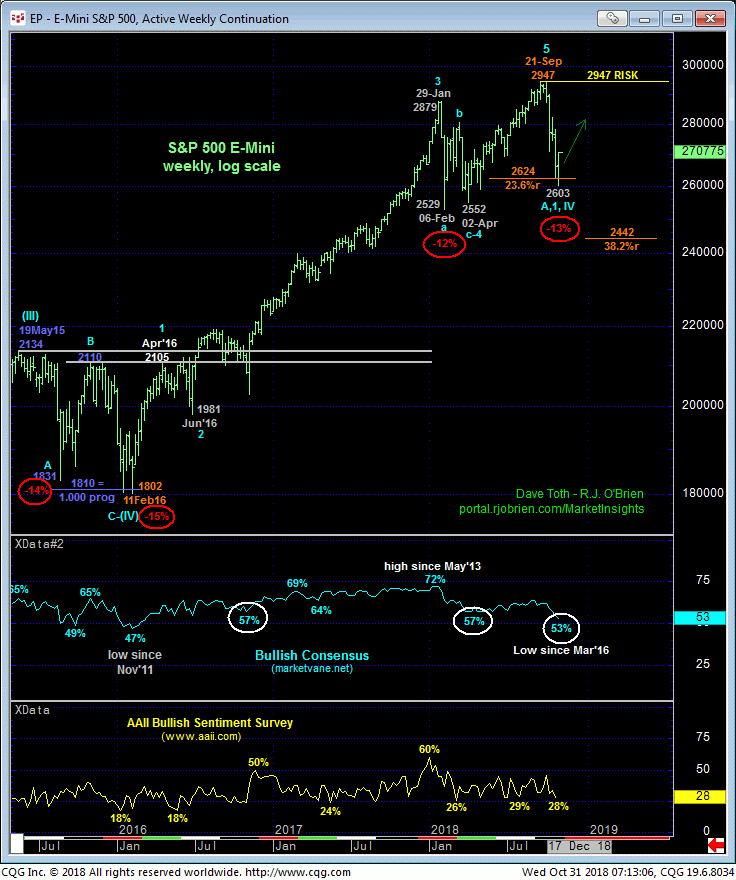
- the 13% decline from 21-Sep’s 2947 all-time high that is right in the wheelhouse of all three of the previous corrections over the past 3-1/2 years
- the understandable erosion to historically bearish sentiment levels that warned of and accompanied the ends of all previous bull market corrections over the past 3-1/2 years.
In sum, we believe that Mon’s 2603 low completed the decline from 21-Sep’s 2947 all-time high and that the market is poised for what could be an extensive corrective rebound to the 2810-area or better OR a resumption of the secular bull. A cautious bullish policy and exposure from at-the-market (2711) is advised with a failure below 2603 required to negate this call and warrant its cover.


